Climate Change Chart of Kuching, Malaysia
Comprehensive Climate Change Chart of Kuching, Malaysia: Monthly Averages and Impact Trends
Explore the changing climate trends in Kuching, Malaysia, through detailed data analysis.
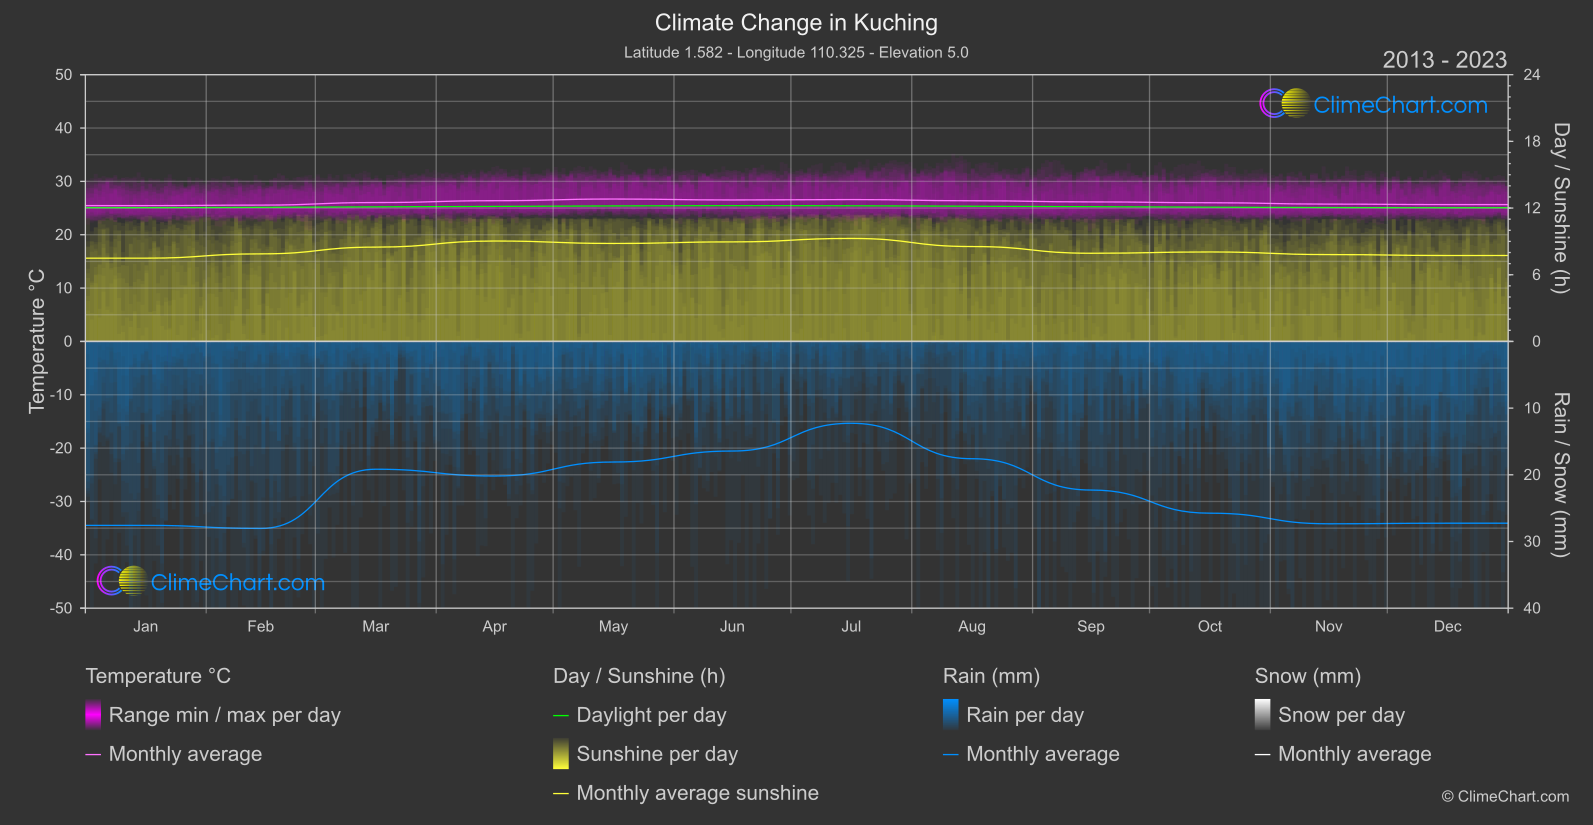
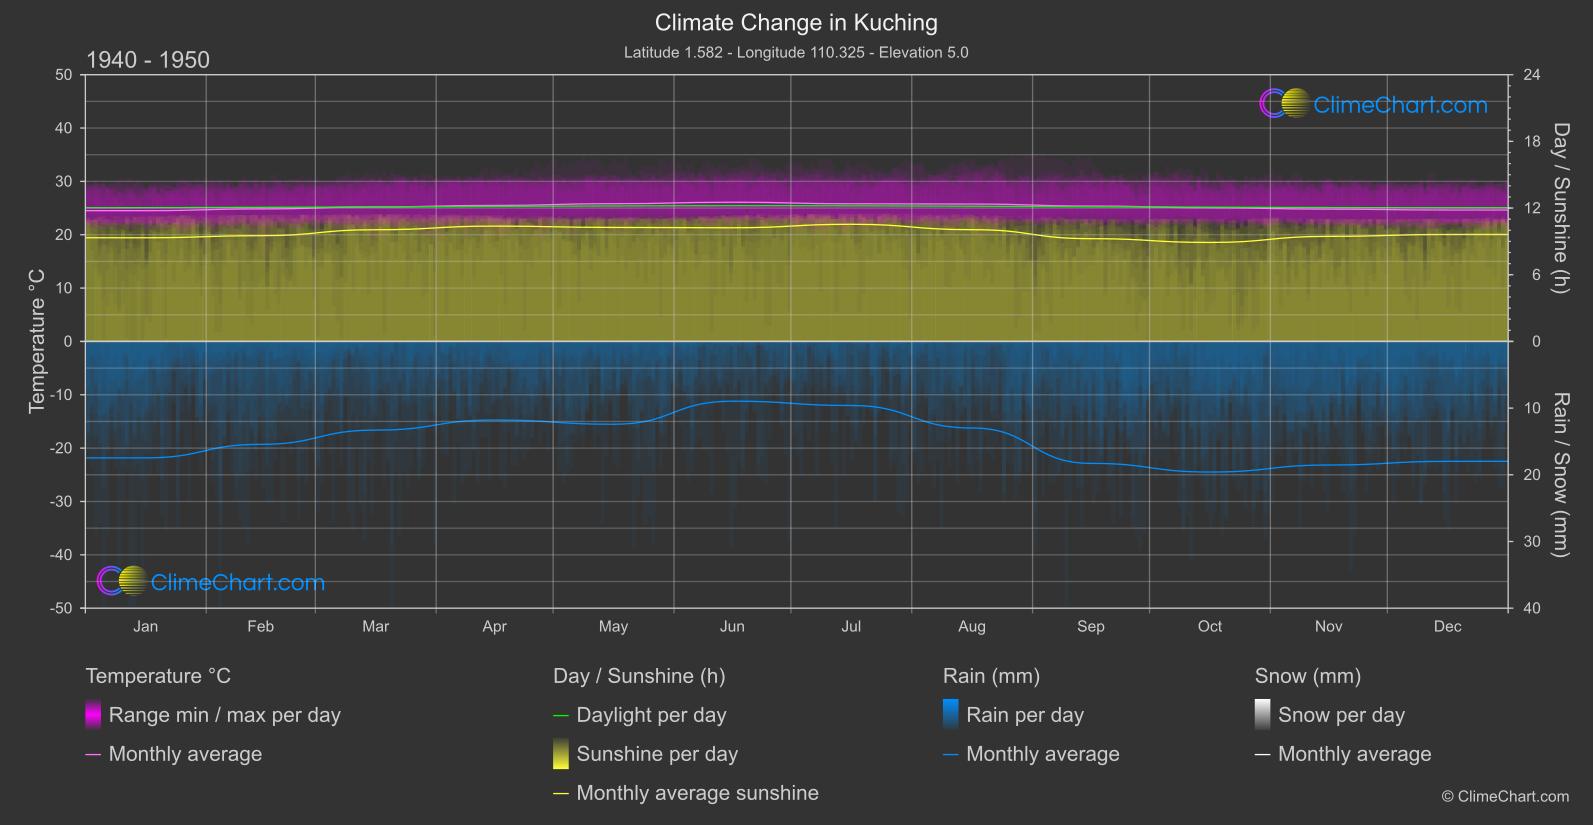
Kuching, Malaysia, has experienced notable changes in temperature, rainfall, and sunshine duration over the years. Comparing the periods of 1940-1950 to 2013-2024, it is evident that temperatures have generally risen, with December showing the highest temperature increase of 1.02°C. Rainfall patterns have also shifted, with February experiencing the largest increase of 6.30mm in precipitation. In terms of sunshine duration, December saw the most significant decrease of nearly 1.89 hours of sunshine.
Climate Change Data Overview for Kuching, Malaysia
Explore the comprehensive climate change data for Kuching, Malaysia. This detailed table provides valuable insights into temperature variations, precipitation levels, and seasonal changes influenced by climate change, helping you understand the unique weather patterns of this region.
Temperature °C
| Month | ⌀ 1940 - 1950 | ⌀ 2013 - 2023 | +/- |
|---|---|---|---|
| Jan | 24.51 | 25.46 | 0.95 |
| Feb | 24.84 | 25.55 | 0.72 |
| Mar | 25.21 | 26.03 | 0.82 |
| Apr | 25.50 | 26.38 | 0.88 |
| May | 25.82 | 26.69 | 0.88 |
| Jun | 26.09 | 26.52 | 0.43 |
| Jul | 25.80 | 26.59 | 0.79 |
| Aug | 25.75 | 26.37 | 0.61 |
| Sep | 25.38 | 26.15 | 0.78 |
| Oct | 25.06 | 26.00 | 0.94 |
| Nov | 24.79 | 25.74 | 0.95 |
| Dec | 24.63 | 25.65 | 1.02 |
| ⌀ Month | 25.28 | 26.09 | 0.81 |
Sunshine (h)
| Month | ⌀ 1940 - 1950 | ⌀ 2013 - 2023 | +/- |
|---|---|---|---|
| Jan | 9.33 | 7.49 | -1.84 |
| Feb | 9.51 | 7.88 | -1.64 |
| Mar | 10.05 | 8.49 | -1.56 |
| Apr | 10.38 | 9.03 | -1.34 |
| May | 10.26 | 8.82 | -1.44 |
| Jun | 10.23 | 8.96 | -1.27 |
| Jul | 10.54 | 9.27 | -1.27 |
| Aug | 10.05 | 8.54 | -1.52 |
| Sep | 9.25 | 7.93 | -1.31 |
| Oct | 8.91 | 8.05 | -0.86 |
| Nov | 9.45 | 7.81 | -1.64 |
| Dec | 9.62 | 7.73 | -1.89 |
| ⌀ Month | 9.80 | 8.33 | -1.47 |
Rain (mm)
| Month | ⌀ 1940 - 1950 | ⌀ 2013 - 2023 | +/- |
|---|---|---|---|
| Jan | 8.73 | 13.79 | 5.06 |
| Feb | 7.72 | 14.02 | 6.30 |
| Mar | 6.65 | 9.58 | 2.93 |
| Apr | 5.89 | 10.09 | 4.20 |
| May | 6.21 | 9.04 | 2.83 |
| Jun | 4.48 | 8.22 | 3.74 |
| Jul | 4.80 | 6.14 | 1.33 |
| Aug | 6.49 | 8.79 | 2.30 |
| Sep | 9.14 | 11.14 | 2.00 |
| Oct | 9.79 | 12.88 | 3.08 |
| Nov | 9.27 | 13.67 | 4.41 |
| Dec | 8.99 | 13.63 | 4.64 |
| ⌀ Month | 7.35 | 10.92 | 3.57 |
Snow (mm)
| Month | ⌀ 1940 - 1950 | ⌀ 2013 - 2023 | +/- |
|---|---|---|---|
| Jan | 0.00 | 0.00 | 0.00 |
| Feb | 0.00 | 0.00 | 0.00 |
| Mar | 0.00 | 0.00 | 0.00 |
| Apr | 0.00 | 0.00 | 0.00 |
| May | 0.00 | 0.00 | 0.00 |
| Jun | 0.00 | 0.00 | 0.00 |
| Jul | 0.00 | 0.00 | 0.00 |
| Aug | 0.00 | 0.00 | 0.00 |
| Sep | 0.00 | 0.00 | 0.00 |
| Oct | 0.00 | 0.00 | 0.00 |
| Nov | 0.00 | 0.00 | 0.00 |
| Dec | 0.00 | 0.00 | 0.00 |
| ⌀ Month | 0.00 | 0.00 | 0.00 |