Climate Chart of Koh Samui, Thailand
Comprehensive Climate Chart of Koh Samui, Thailand: Monthly Averages and Weather Trends
Discover the tropical paradise of Koh Samui, Thailand
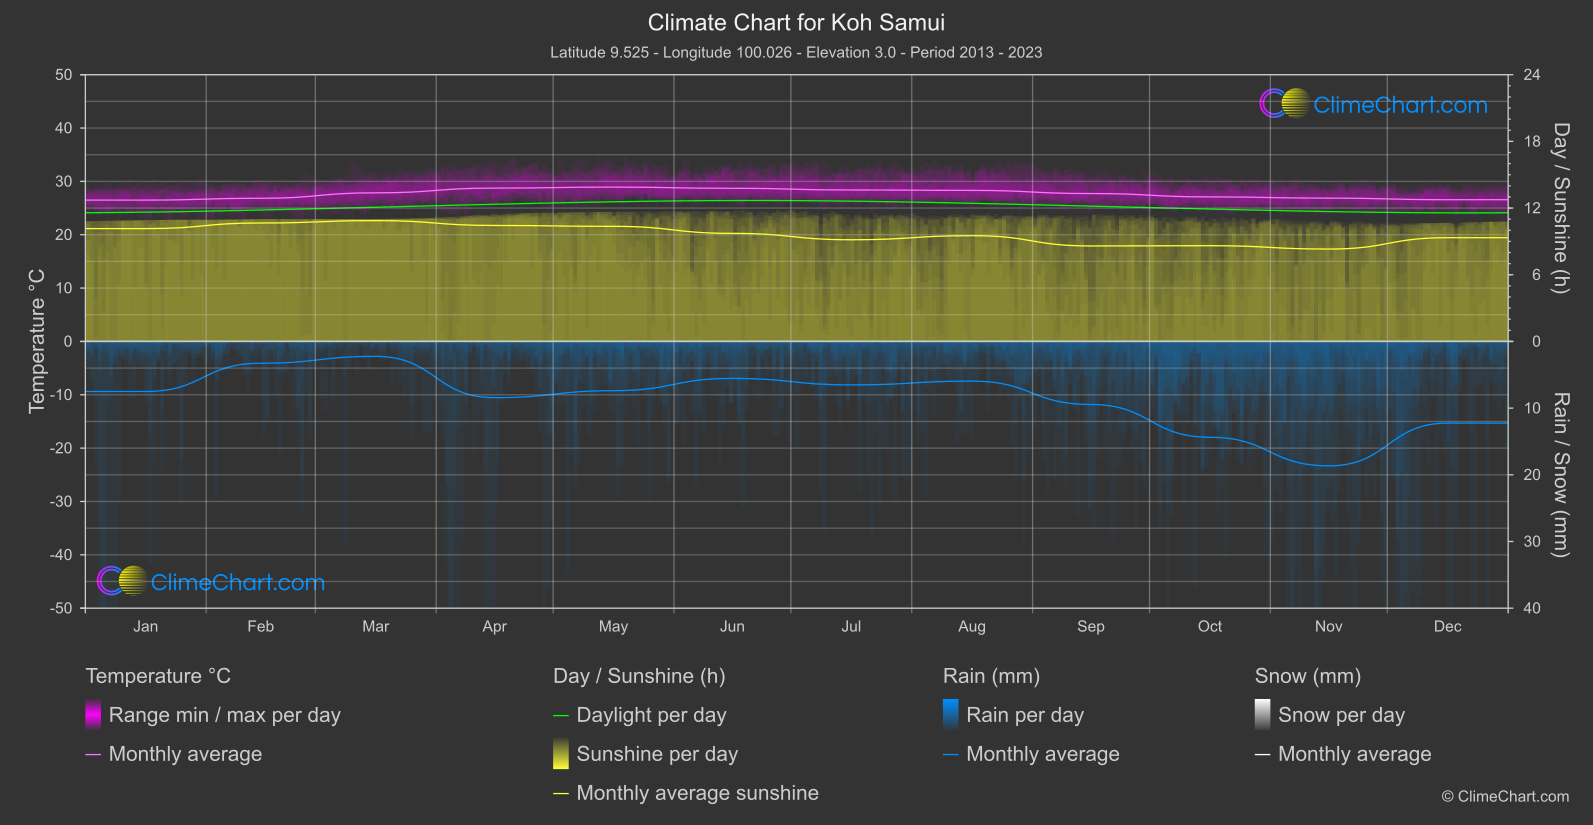
Koh Samui, located in the Gulf of Thailand, enjoys a tropical climate with warm temperatures year-round. The island experiences a wet season from September to December, with the heaviest rainfall in November. The dry season runs from January to August, with March and April being the hottest months. The average temperature hovers around 28-32°C (82-90°F) throughout the year, making it an ideal destination for beach lovers and sun-seekers.
Best Travel Time Guide for Koh Samui, Thailand: Ideal Seasons and Weather Insights
The best time to travel to Koh Samui is during the dry season from January to August when the weather is sunny and ideal for beach activities. March and April offer the warmest temperatures, perfect for sunbathing and swimming. If you prefer fewer crowds, consider visiting in the shoulder months of January, February, July, or August. Avoid the wet season from September to December if you want to minimize the chance of rain disrupting your plans.
Climate Data Overview for Koh Samui, Thailand
Explore the comprehensive climate data for Koh Samui, Thailand. This detailed table provides valuable insights into temperature variations, precipitation levels, and seasonal changes, helping you understand the unique weather patterns of this region.
| Month | ⌀ Temperature °C | ⌀ Rain (mm) | ⌀ Snow (mm) | ⌀ Sunshine (h) |
|---|---|---|---|---|
| Jan | 26.5 | 3.75 | 0.00 | 10.15 |
| Feb | 26.8 | 1.63 | 0.00 | 10.66 |
| Mar | 27.9 | 1.12 | 0.00 | 10.87 |
| Apr | 28.7 | 4.22 | 0.00 | 10.43 |
| May | 28.9 | 3.69 | 0.00 | 10.35 |
| Jun | 28.7 | 2.77 | 0.00 | 9.72 |
| Jul | 28.4 | 3.26 | 0.00 | 9.15 |
| Aug | 28.3 | 2.98 | 0.00 | 9.51 |
| Sep | 27.7 | 4.73 | 0.00 | 8.59 |
| Oct | 27.1 | 7.19 | 0.00 | 8.61 |
| Nov | 26.9 | 9.33 | 0.00 | 8.31 |
| Dec | 26.6 | 6.12 | 0.00 | 9.33 |
| ⌀ Month | 27.7 | 4.23 | 0.00 | 9.64 |