Climate Change Chart of Koh Samui, Thailand
Comprehensive Climate Change Chart of Koh Samui, Thailand: Monthly Averages and Impact Trends
Exploring the changing climate in Koh Samui, Thailand reveals intriguing insights into temperature, rainfall, and sunshine duration trends over the years.
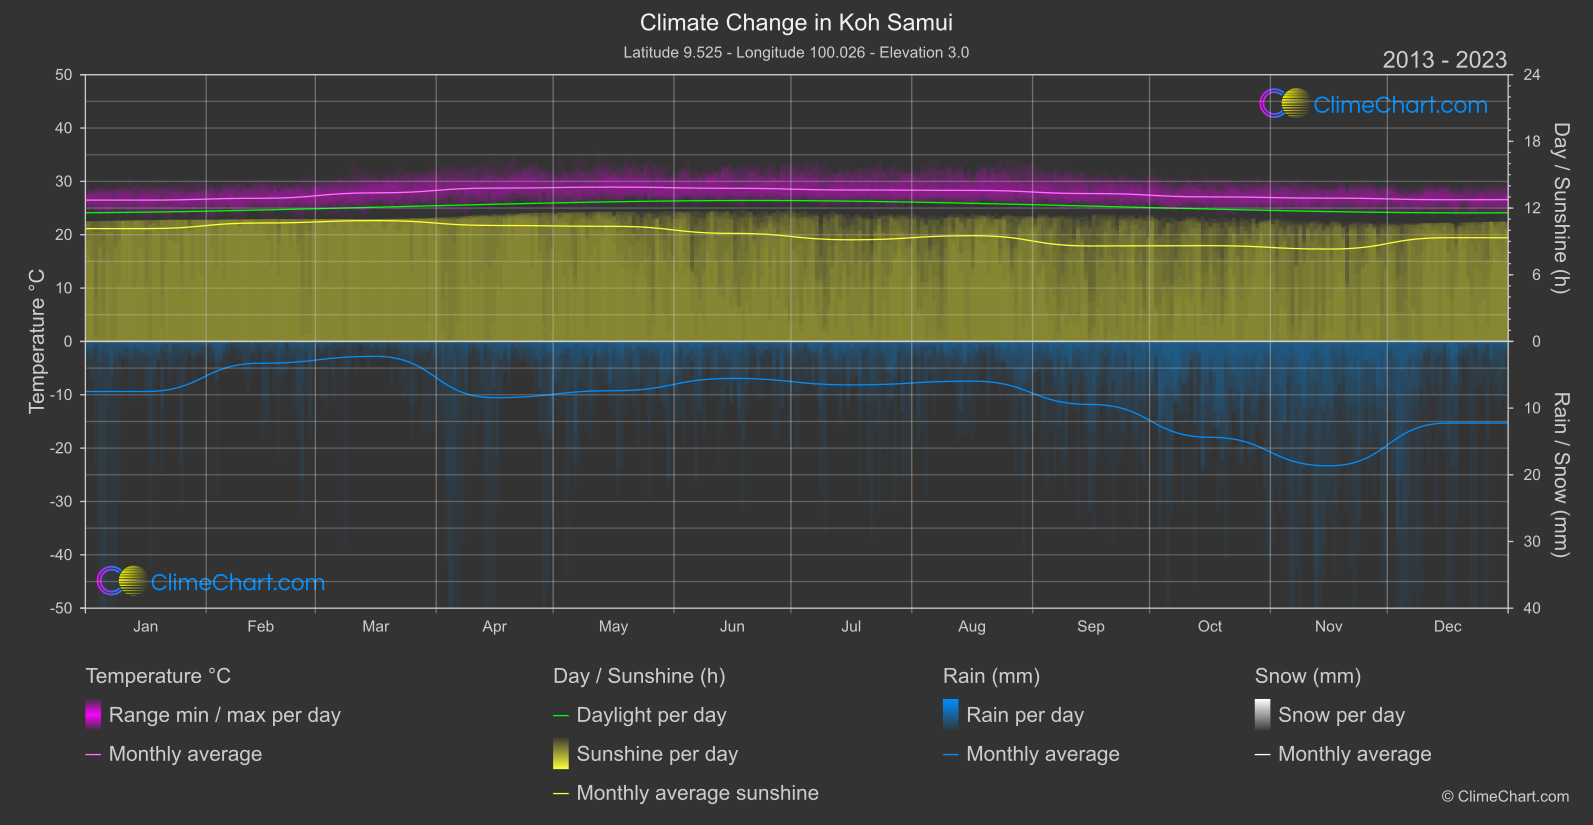
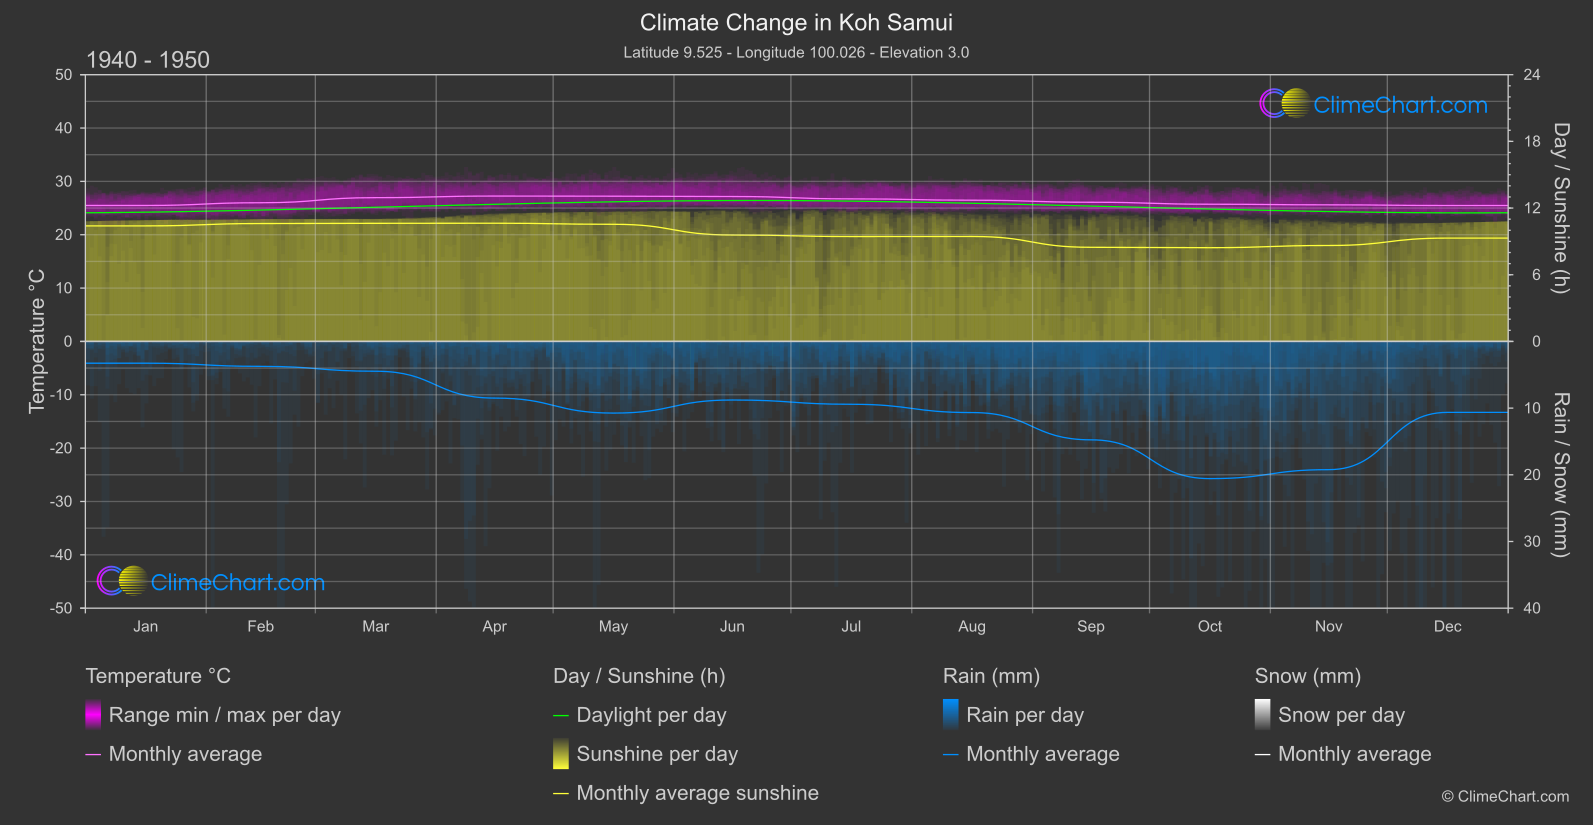
Koh Samui, one of Thailand's most popular tourist destinations, has experienced notable changes in its climate patterns. Analyzing the temperature data, it is evident that there has been a consistent increase in temperatures across most months, with the highest change observed in June. Additionally, the rainfall patterns have also shifted over the years, with significant decreases in rainfall during the months of October and September. The sunshine duration has shown varying trends, with certain months experiencing a decrease in sunlight hours while others have seen a slight increase.
Climate Change Data Overview for Koh Samui, Thailand
Explore the comprehensive climate change data for Koh Samui, Thailand. This detailed table provides valuable insights into temperature variations, precipitation levels, and seasonal changes influenced by climate change, helping you understand the unique weather patterns of this region.
Temperature °C
| Month | ⌀ 1940 - 1950 | ⌀ 2013 - 2023 | +/- |
|---|---|---|---|
| Jan | 25.49 | 26.49 | 1.01 |
| Feb | 26.00 | 26.83 | 0.84 |
| Mar | 26.95 | 27.86 | 0.90 |
| Apr | 27.25 | 28.74 | 1.49 |
| May | 27.23 | 28.93 | 1.70 |
| Jun | 27.16 | 28.70 | 1.54 |
| Jul | 26.72 | 28.39 | 1.67 |
| Aug | 26.47 | 28.31 | 1.84 |
| Sep | 26.09 | 27.72 | 1.63 |
| Oct | 25.72 | 27.09 | 1.37 |
| Nov | 25.60 | 26.86 | 1.26 |
| Dec | 25.48 | 26.56 | 1.09 |
| ⌀ Month | 26.35 | 27.71 | 1.36 |
Sunshine (h)
| Month | ⌀ 1940 - 1950 | ⌀ 2013 - 2023 | +/- |
|---|---|---|---|
| Jan | 10.40 | 10.15 | -0.25 |
| Feb | 10.61 | 10.66 | 0.05 |
| Mar | 10.63 | 10.87 | 0.24 |
| Apr | 10.64 | 10.43 | -0.20 |
| May | 10.54 | 10.35 | -0.19 |
| Jun | 9.58 | 9.72 | 0.15 |
| Jul | 9.44 | 9.15 | -0.29 |
| Aug | 9.44 | 9.51 | 0.07 |
| Sep | 8.47 | 8.59 | 0.12 |
| Oct | 8.43 | 8.61 | 0.18 |
| Nov | 8.63 | 8.31 | -0.32 |
| Dec | 9.30 | 9.33 | 0.03 |
| ⌀ Month | 9.67 | 9.64 | -0.03 |
Rain (mm)
| Month | ⌀ 1940 - 1950 | ⌀ 2013 - 2023 | +/- |
|---|---|---|---|
| Jan | 1.63 | 3.75 | 2.12 |
| Feb | 1.87 | 1.63 | -0.23 |
| Mar | 2.23 | 1.12 | -1.11 |
| Apr | 4.25 | 4.22 | -0.03 |
| May | 5.37 | 3.69 | -1.68 |
| Jun | 4.39 | 2.77 | -1.62 |
| Jul | 4.71 | 3.26 | -1.45 |
| Aug | 5.33 | 2.98 | -2.36 |
| Sep | 7.38 | 4.73 | -2.65 |
| Oct | 10.29 | 7.19 | -3.10 |
| Nov | 9.61 | 9.33 | -0.29 |
| Dec | 5.32 | 6.12 | 0.80 |
| ⌀ Month | 5.20 | 4.23 | -0.97 |
Snow (mm)
| Month | ⌀ 1940 - 1950 | ⌀ 2013 - 2023 | +/- |
|---|---|---|---|
| Jan | 0.00 | 0.00 | 0.00 |
| Feb | 0.00 | 0.00 | 0.00 |
| Mar | 0.00 | 0.00 | 0.00 |
| Apr | 0.00 | 0.00 | 0.00 |
| May | 0.00 | 0.00 | 0.00 |
| Jun | 0.00 | 0.00 | 0.00 |
| Jul | 0.00 | 0.00 | 0.00 |
| Aug | 0.00 | 0.00 | 0.00 |
| Sep | 0.00 | 0.00 | 0.00 |
| Oct | 0.00 | 0.00 | 0.00 |
| Nov | 0.00 | 0.00 | 0.00 |
| Dec | 0.00 | 0.00 | 0.00 |
| ⌀ Month | 0.00 | 0.00 | 0.00 |