Climate Chart of Juarez City, Mexico
Comprehensive Climate Chart of Juarez City, Mexico: Monthly Averages and Weather Trends
Discover the Climate of Juarez City, Mexico
Juarez City, located in northern Mexico, experiences a desert climate with hot summers and mild winters. The city receives minimal rainfall throughout the year, with most precipitation occurring during the summer months. Temperatures can soar above 100°F (38°C) in the summer, while winter temperatures typically range from 30-60°F (-1 to 15°C). The region is known for its sunny weather, making it an ideal destination for those seeking warm, dry conditions.
Best Travel Time Guide for Juarez City, Mexico: Ideal Seasons and Weather Insights
The best time to travel to Juarez City is during the fall and spring months when temperatures are milder and the weather is pleasant. Avoid visiting during the peak of summer when temperatures can be scorching. Winter is also a good time to visit if you enjoy cooler weather. Pack sunscreen, sunglasses, and light clothing for your trip to Juarez City.
Climate Data Overview for Juarez City, Mexico
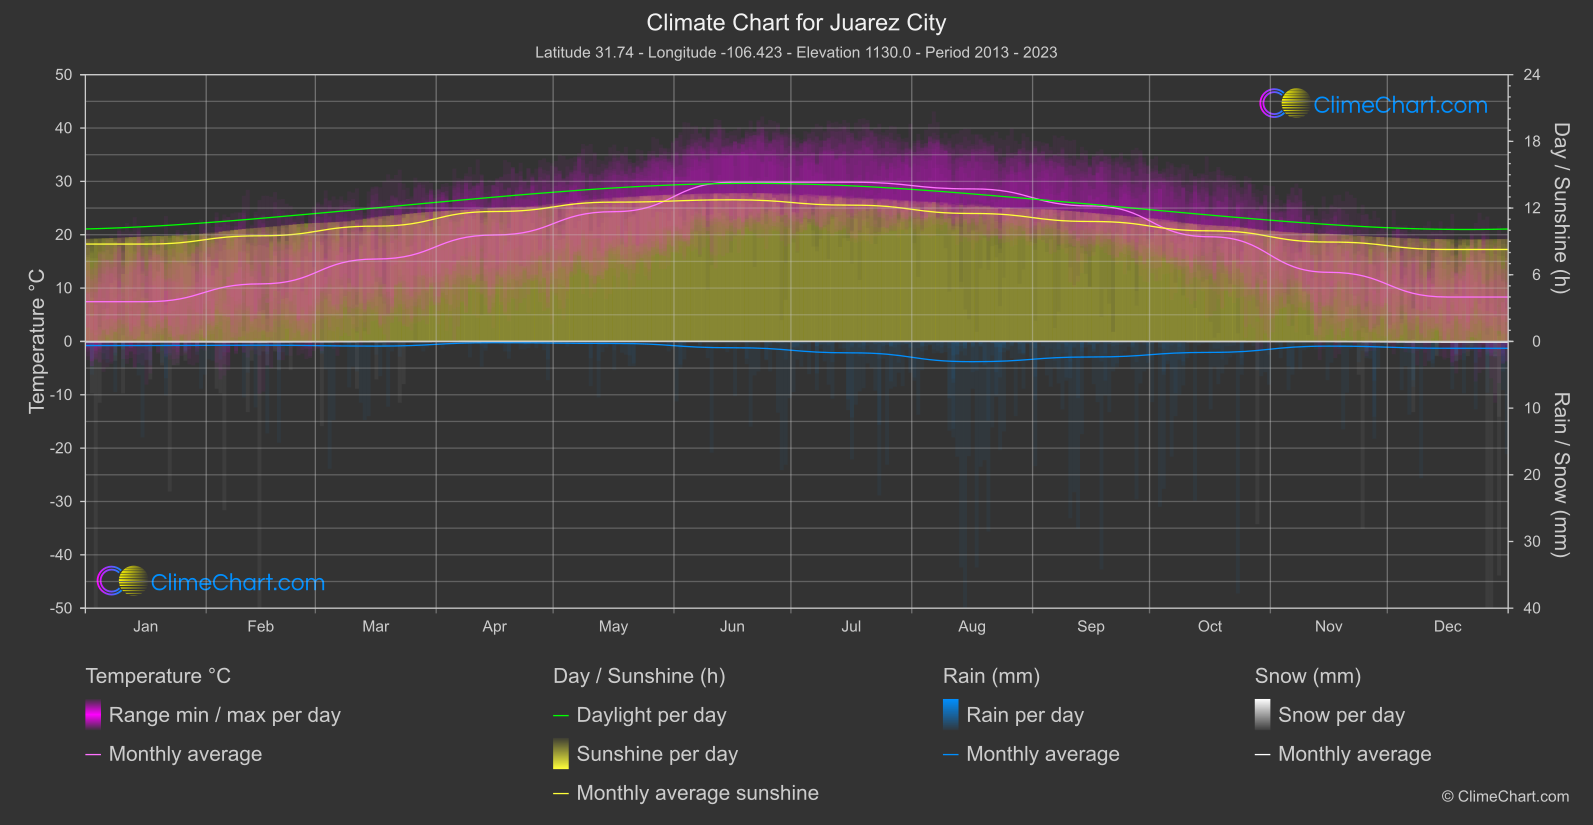
Explore the comprehensive climate data for Juarez City, Mexico. This detailed table provides valuable insights into temperature variations, precipitation levels, and seasonal changes, helping you understand the unique weather patterns of this region.
| Month | ⌀ Temperature °C | ⌀ Rain (mm) | ⌀ Snow (mm) | ⌀ Sunshine (h) |
|---|---|---|---|---|
| Jan | 7.4 | 0.31 | 0.03 | 8.76 |
| Feb | 10.8 | 0.28 | 0.04 | 9.51 |
| Mar | 15.4 | 0.35 | 0.01 | 10.37 |
| Apr | 20.0 | 0.09 | 0.00 | 11.69 |
| May | 24.3 | 0.15 | 0.00 | 12.53 |
| Jun | 29.8 | 0.47 | 0.00 | 12.74 |
| Jul | 29.8 | 0.86 | 0.00 | 12.26 |
| Aug | 28.6 | 1.52 | 0.00 | 11.51 |
| Sep | 25.4 | 1.17 | 0.00 | 10.79 |
| Oct | 19.6 | 0.82 | 0.01 | 9.95 |
| Nov | 13.0 | 0.35 | 0.01 | 8.94 |
| Dec | 8.3 | 0.51 | 0.05 | 8.27 |
| ⌀ Month | 19.4 | 0.57 | 0.01 | 10.61 |