Climate Change Chart of Juarez City, Mexico
Comprehensive Climate Change Chart of Juarez City, Mexico: Monthly Averages and Impact Trends
Exploring the climate changes in Juarez City, Mexico reveals intriguing data on temperature, rainfall, snowfall, and sunshine duration over the years. Let's delve into the insights provided by the datasets.
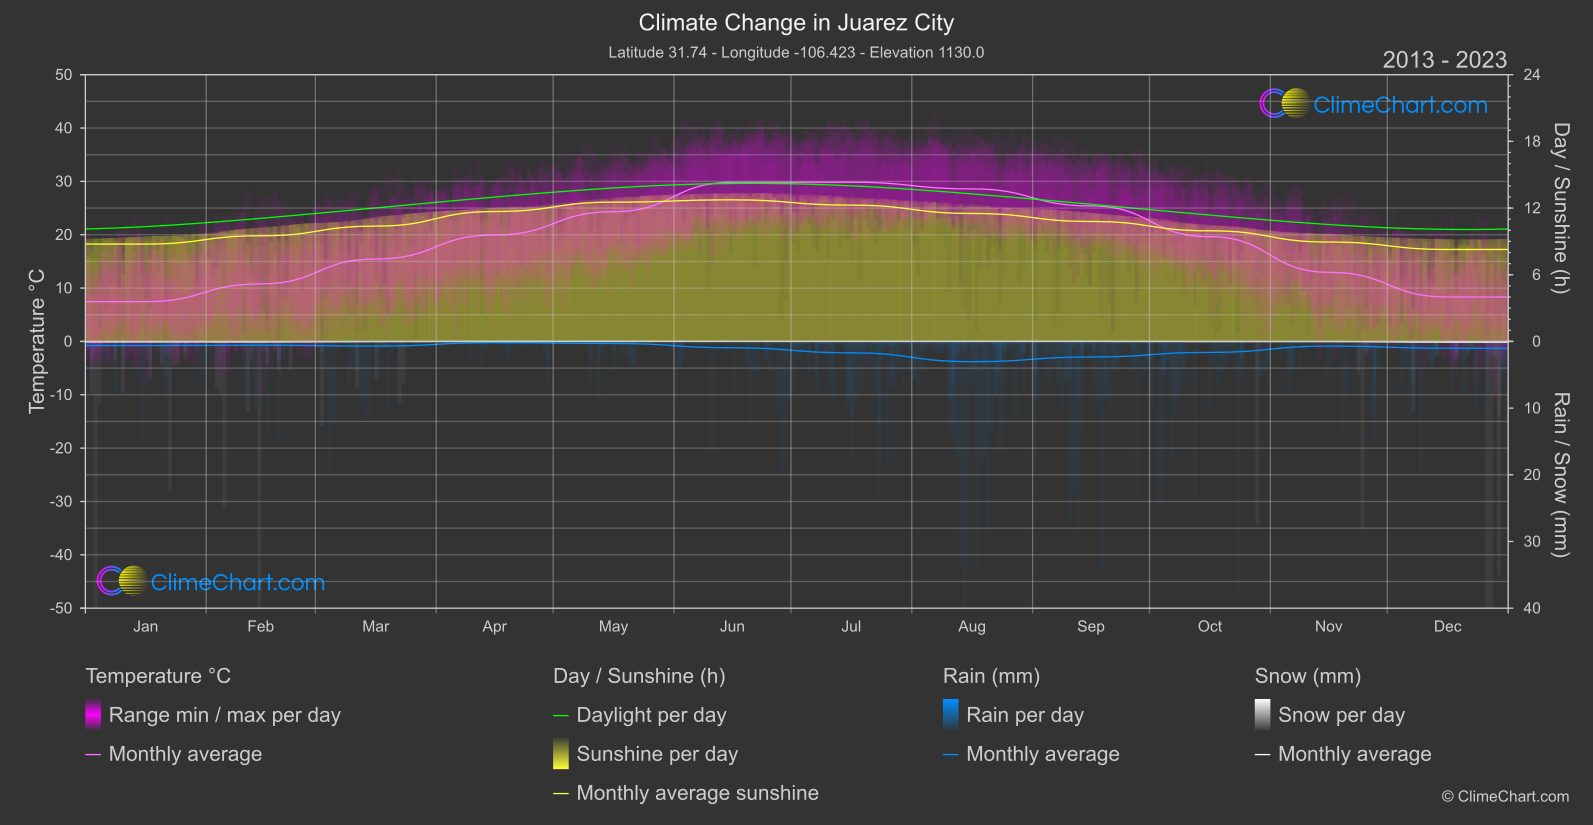
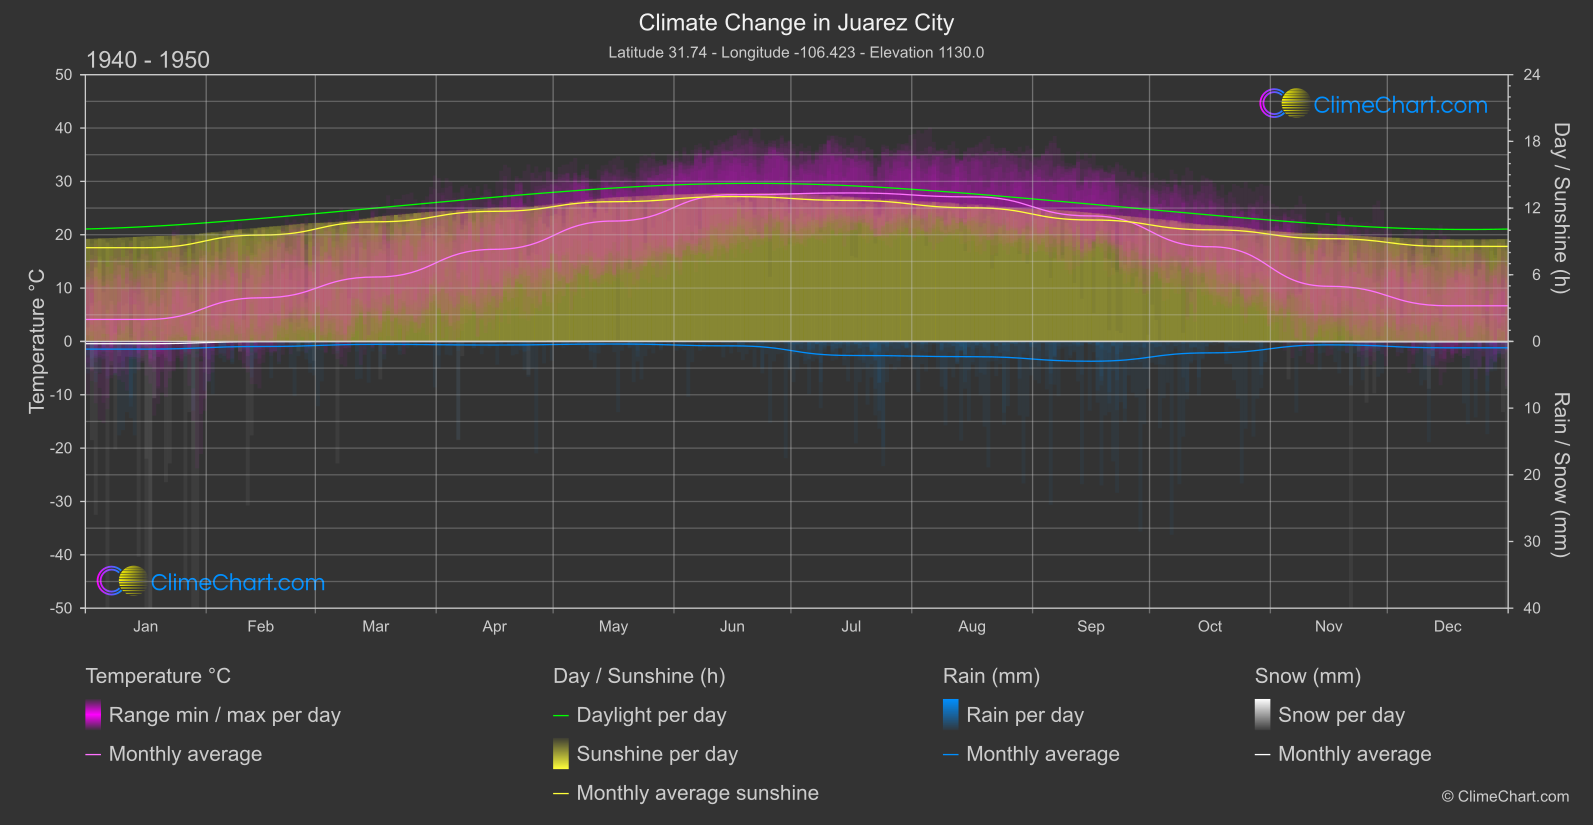
Juarez City, Mexico, has experienced notable changes in its climate patterns. Analyzing the temperature data from the 1940s to 1950s compared to the period of 2013 to 2024, we observe significant increases in temperatures across various months. March stands out with a temperature change of 3.37°C, indicating a substantial warming trend. On the other hand, when examining rainfall data, we find that July experienced a decrease in rainfall by 0.20 mm. Snowfall in Juarez City has generally declined, with December showing a decrease of 0.25 mm. Additionally, the sunshine duration has shown fluctuations, notably with August experiencing a decrease of 0.51 hours of sunshine. These insights demonstrate the dynamic climate shifts in Juarez City over the years.
Climate Change Data Overview for Juarez City, Mexico
Explore the comprehensive climate change data for Juarez City, Mexico. This detailed table provides valuable insights into temperature variations, precipitation levels, and seasonal changes influenced by climate change, helping you understand the unique weather patterns of this region.
Temperature °C
| Month | ⌀ 1940 - 1950 | ⌀ 2013 - 2023 | +/- |
|---|---|---|---|
| Jan | 4.12 | 7.45 | 3.33 |
| Feb | 8.18 | 10.79 | 2.61 |
| Mar | 12.08 | 15.44 | 3.37 |
| Apr | 17.26 | 19.96 | 2.70 |
| May | 22.57 | 24.32 | 1.76 |
| Jun | 27.50 | 29.83 | 2.33 |
| Jul | 27.83 | 29.85 | 2.02 |
| Aug | 27.10 | 28.59 | 1.49 |
| Sep | 23.52 | 25.40 | 1.88 |
| Oct | 17.75 | 19.62 | 1.87 |
| Nov | 10.34 | 12.96 | 2.62 |
| Dec | 6.69 | 8.32 | 1.64 |
| ⌀ Month | 17.08 | 19.38 | 2.30 |
Sunshine (h)
| Month | ⌀ 1940 - 1950 | ⌀ 2013 - 2023 | +/- |
|---|---|---|---|
| Jan | 8.43 | 8.76 | 0.33 |
| Feb | 9.57 | 9.51 | -0.07 |
| Mar | 10.76 | 10.37 | -0.39 |
| Apr | 11.71 | 11.69 | -0.02 |
| May | 12.57 | 12.53 | -0.04 |
| Jun | 13.03 | 12.74 | -0.30 |
| Jul | 12.68 | 12.26 | -0.42 |
| Aug | 12.02 | 11.51 | -0.51 |
| Sep | 10.93 | 10.79 | -0.13 |
| Oct | 10.04 | 9.95 | -0.09 |
| Nov | 9.25 | 8.94 | -0.30 |
| Dec | 8.55 | 8.27 | -0.28 |
| ⌀ Month | 10.80 | 10.61 | -0.18 |
Rain (mm)
| Month | ⌀ 1940 - 1950 | ⌀ 2013 - 2023 | +/- |
|---|---|---|---|
| Jan | 0.58 | 0.31 | -0.27 |
| Feb | 0.38 | 0.28 | -0.10 |
| Mar | 0.22 | 0.35 | 0.13 |
| Apr | 0.27 | 0.09 | -0.17 |
| May | 0.19 | 0.15 | -0.04 |
| Jun | 0.33 | 0.47 | 0.14 |
| Jul | 1.05 | 0.86 | -0.20 |
| Aug | 1.14 | 1.52 | 0.37 |
| Sep | 1.48 | 1.17 | -0.32 |
| Oct | 0.86 | 0.82 | -0.04 |
| Nov | 0.26 | 0.35 | 0.10 |
| Dec | 0.48 | 0.51 | 0.03 |
| ⌀ Month | 0.60 | 0.57 | -0.03 |
Snow (mm)
| Month | ⌀ 1940 - 1950 | ⌀ 2013 - 2023 | +/- |
|---|---|---|---|
| Jan | 0.17 | 0.03 | -0.14 |
| Feb | 0.01 | 0.04 | 0.02 |
| Mar | 0.01 | 0.01 | 0.01 |
| Apr | 0.01 | 0.00 | -0.01 |
| May | 0.00 | 0.00 | 0.00 |
| Jun | 0.00 | 0.00 | 0.00 |
| Jul | 0.00 | 0.00 | 0.00 |
| Aug | 0.00 | 0.00 | 0.00 |
| Sep | 0.00 | 0.00 | 0.00 |
| Oct | 0.00 | 0.01 | 0.01 |
| Nov | 0.02 | 0.01 | -0.01 |
| Dec | 0.03 | 0.05 | 0.02 |
| ⌀ Month | 0.02 | 0.01 | -0.01 |