Climate Chart of Johor Bahru, Malaysia
Comprehensive Climate Chart of Johor Bahru, Malaysia: Monthly Averages and Weather Trends
Discover the climate of Johor Bahru, Malaysia.
Johor Bahru, located in southern Malaysia, experiences a tropical rainforest climate. The city enjoys hot and humid weather throughout the year, with the heaviest rainfall occurring from November to January. The average temperature ranges from 25°C to 31°C, making it a warm destination for travelers. Be prepared for occasional thunderstorms, especially during the monsoon season.
Best Travel Time Guide for Johor Bahru, Malaysia: Ideal Seasons and Weather Insights
The best time to travel to Johor Bahru is during the dry season from June to August when the weather is relatively cooler. This period offers sunny days and is ideal for exploring the city's attractions. However, if you prefer fewer crowds, consider visiting during the shoulder months of March to May or September to November.
Climate Data Overview for Johor Bahru, Malaysia
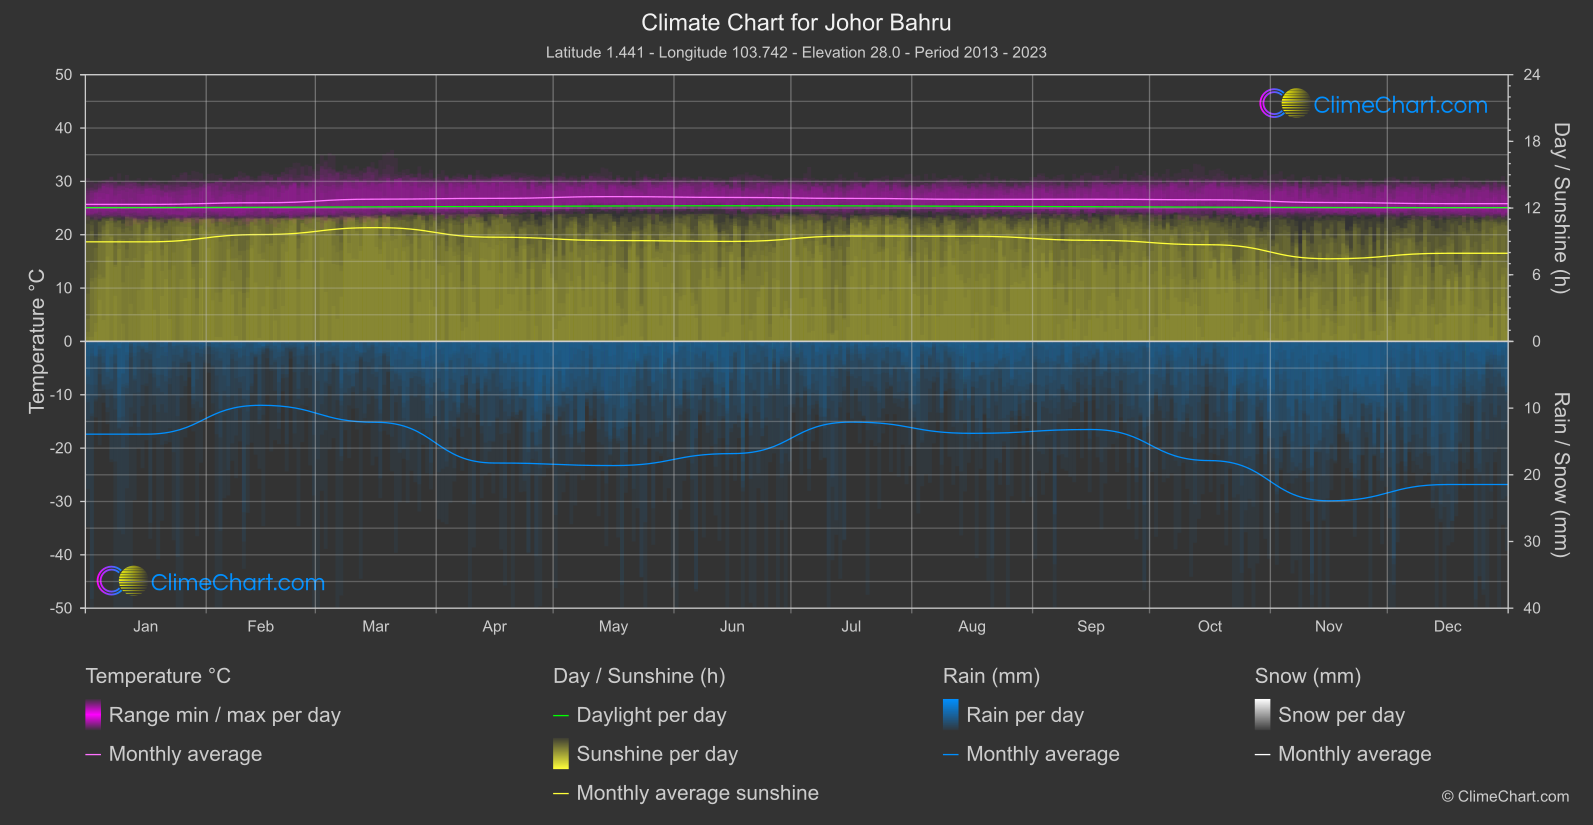
Explore the comprehensive climate data for Johor Bahru, Malaysia. This detailed table provides valuable insights into temperature variations, precipitation levels, and seasonal changes, helping you understand the unique weather patterns of this region.
| Month | ⌀ Temperature °C | ⌀ Rain (mm) | ⌀ Snow (mm) | ⌀ Sunshine (h) |
|---|---|---|---|---|
| Jan | 25.7 | 6.95 | 0.00 | 8.96 |
| Feb | 26.0 | 4.79 | 0.00 | 9.62 |
| Mar | 26.7 | 6.06 | 0.00 | 10.24 |
| Apr | 26.8 | 9.12 | 0.00 | 9.38 |
| May | 27.1 | 9.31 | 0.00 | 9.08 |
| Jun | 27.0 | 8.41 | 0.00 | 9.00 |
| Jul | 26.8 | 6.05 | 0.00 | 9.48 |
| Aug | 26.6 | 6.89 | 0.00 | 9.46 |
| Sep | 26.7 | 6.60 | 0.00 | 9.10 |
| Oct | 26.5 | 8.93 | 0.00 | 8.70 |
| Nov | 26.0 | 11.95 | 0.00 | 7.44 |
| Dec | 25.8 | 10.73 | 0.00 | 7.93 |
| ⌀ Month | 26.5 | 7.98 | 0.00 | 9.03 |