Climate Change Chart of Johor Bahru, Malaysia
Comprehensive Climate Change Chart of Johor Bahru, Malaysia: Monthly Averages and Impact Trends
Explore the changing climate in Johor Bahru, Malaysia with insights from temperature, rainfall, and sunshine duration data.
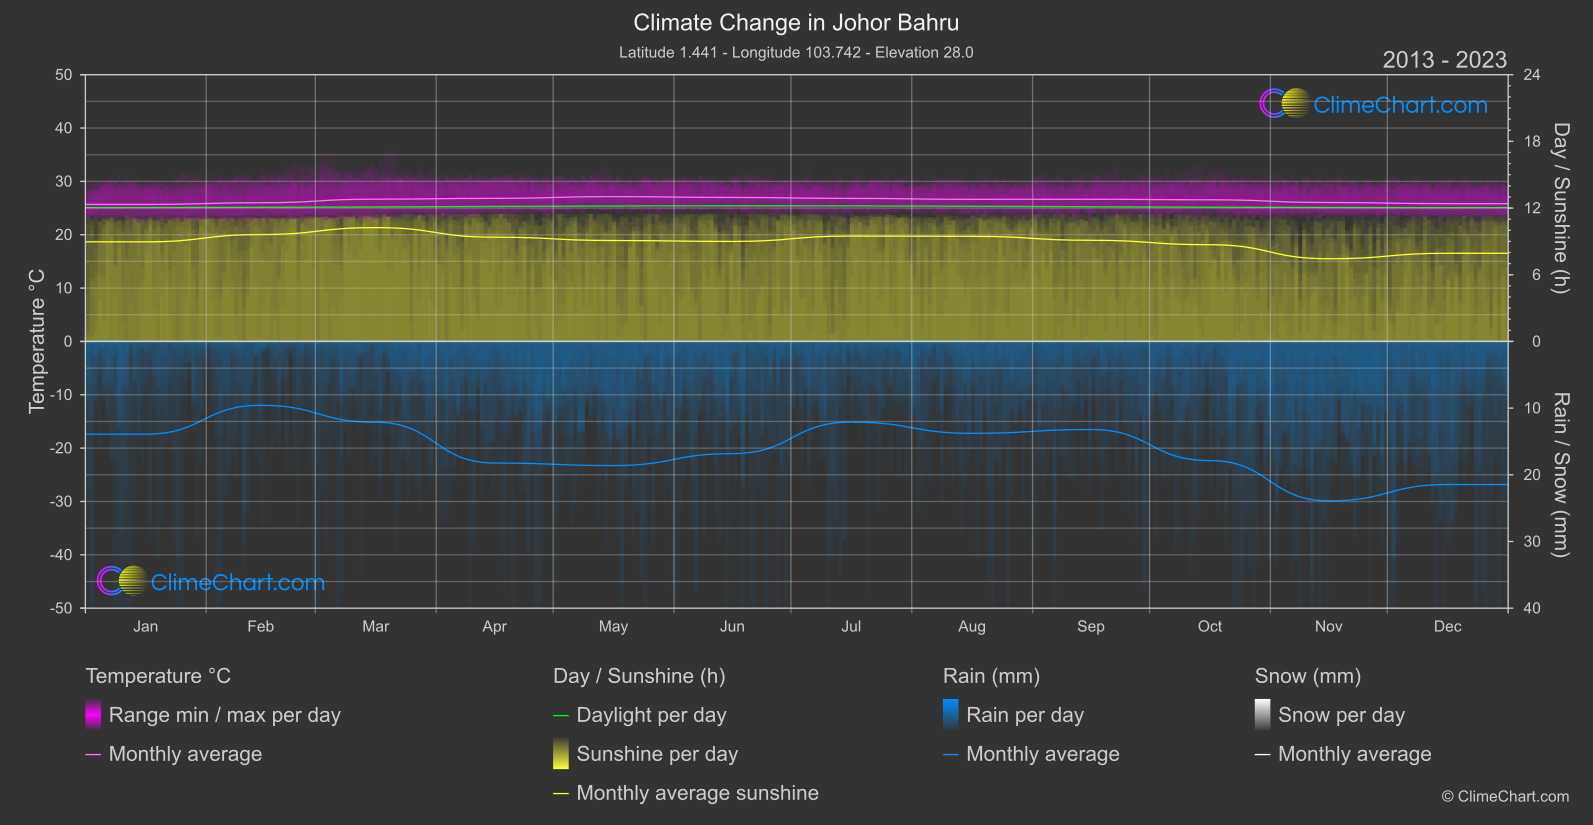
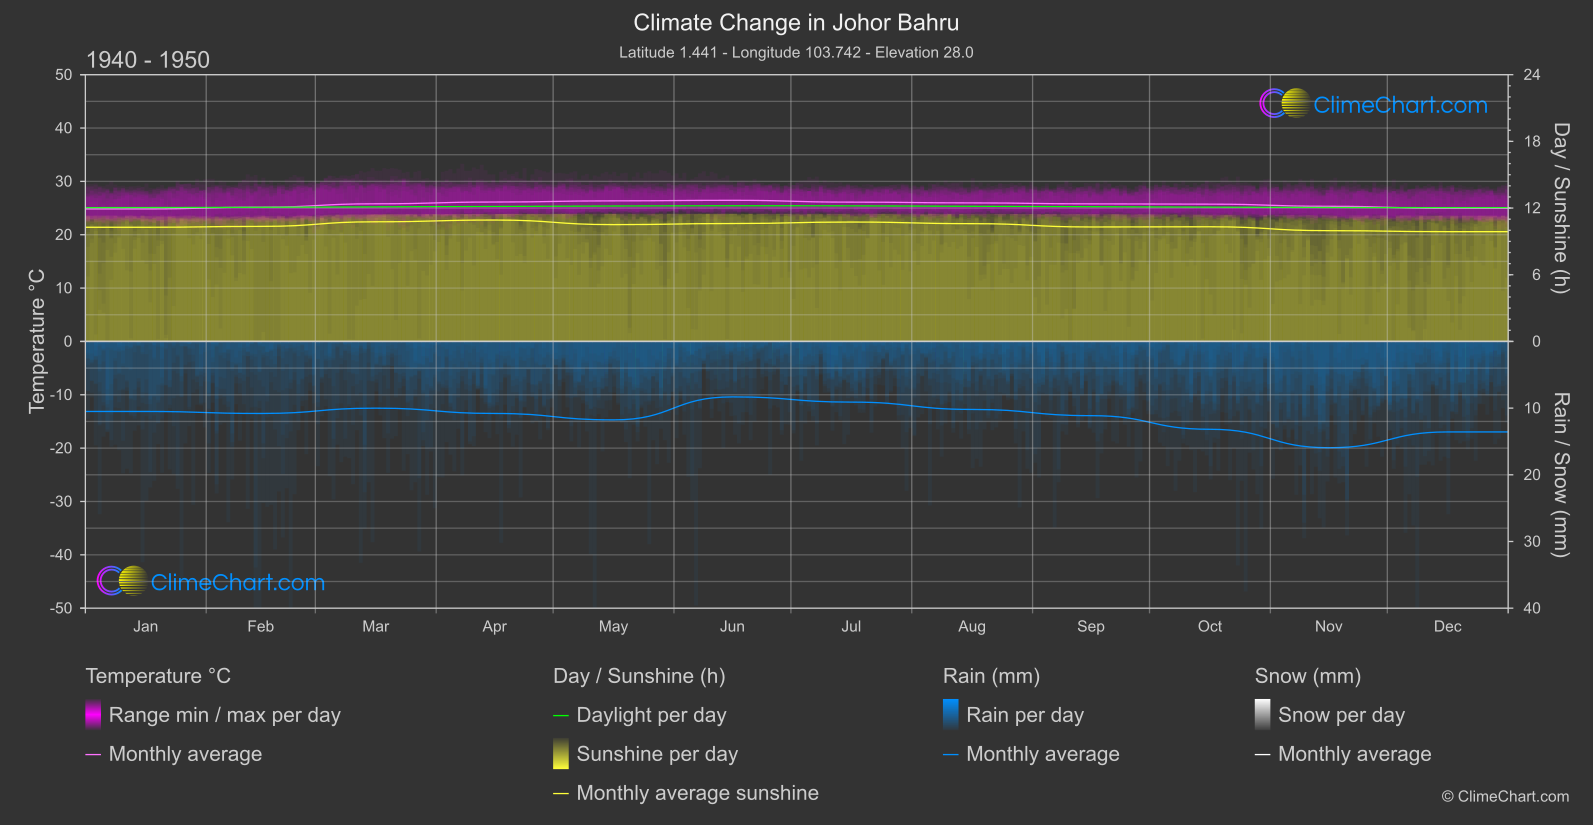
Johor Bahru, Malaysia, has experienced notable changes in climate over the years. Analyzing the data, it is observed that the month with the highest temperature change is December, with a significant increase of 0.87°C between the periods 1940-1950 and 2013-2024. On the other hand, the month with the most significant rainfall change is November, showing an increase of 3.98mm. Additionally, the sunshine duration has decreased across all months, with the largest drop of 2.53 hours in November. These insights shed light on the climate trends in Johor Bahru, emphasizing the importance of monitoring and addressing climate change.
Climate Change Data Overview for Johor Bahru, Malaysia
Explore the comprehensive climate change data for Johor Bahru, Malaysia. This detailed table provides valuable insights into temperature variations, precipitation levels, and seasonal changes influenced by climate change, helping you understand the unique weather patterns of this region.
Temperature °C
| Month | ⌀ 1940 - 1950 | ⌀ 2013 - 2023 | +/- |
|---|---|---|---|
| Jan | 24.83 | 25.68 | 0.85 |
| Feb | 25.17 | 25.99 | 0.83 |
| Mar | 25.80 | 26.67 | 0.87 |
| Apr | 26.13 | 26.82 | 0.69 |
| May | 26.35 | 27.15 | 0.79 |
| Jun | 26.45 | 26.99 | 0.54 |
| Jul | 26.11 | 26.81 | 0.70 |
| Aug | 25.97 | 26.64 | 0.67 |
| Sep | 25.79 | 26.65 | 0.87 |
| Oct | 25.73 | 26.55 | 0.81 |
| Nov | 25.33 | 26.04 | 0.71 |
| Dec | 24.95 | 25.82 | 0.87 |
| ⌀ Month | 25.72 | 26.48 | 0.77 |
Sunshine (h)
| Month | ⌀ 1940 - 1950 | ⌀ 2013 - 2023 | +/- |
|---|---|---|---|
| Jan | 10.27 | 8.96 | -1.31 |
| Feb | 10.35 | 9.62 | -0.73 |
| Mar | 10.76 | 10.24 | -0.52 |
| Apr | 10.92 | 9.38 | -1.54 |
| May | 10.51 | 9.08 | -1.43 |
| Jun | 10.61 | 9.00 | -1.61 |
| Jul | 10.74 | 9.48 | -1.26 |
| Aug | 10.60 | 9.46 | -1.14 |
| Sep | 10.30 | 9.10 | -1.20 |
| Oct | 10.32 | 8.70 | -1.62 |
| Nov | 9.96 | 7.44 | -2.53 |
| Dec | 9.88 | 7.93 | -1.94 |
| ⌀ Month | 10.43 | 9.03 | -1.40 |
Rain (mm)
| Month | ⌀ 1940 - 1950 | ⌀ 2013 - 2023 | +/- |
|---|---|---|---|
| Jan | 5.25 | 6.95 | 1.70 |
| Feb | 5.40 | 4.79 | -0.61 |
| Mar | 5.00 | 6.06 | 1.06 |
| Apr | 5.40 | 9.12 | 3.72 |
| May | 5.88 | 9.31 | 3.42 |
| Jun | 4.16 | 8.41 | 4.25 |
| Jul | 4.55 | 6.05 | 1.50 |
| Aug | 5.10 | 6.89 | 1.79 |
| Sep | 5.57 | 6.60 | 1.04 |
| Oct | 6.59 | 8.93 | 2.35 |
| Nov | 7.97 | 11.95 | 3.98 |
| Dec | 6.79 | 10.73 | 3.94 |
| ⌀ Month | 5.64 | 7.98 | 2.34 |
Snow (mm)
| Month | ⌀ 1940 - 1950 | ⌀ 2013 - 2023 | +/- |
|---|---|---|---|
| Jan | 0.00 | 0.00 | 0.00 |
| Feb | 0.00 | 0.00 | 0.00 |
| Mar | 0.00 | 0.00 | 0.00 |
| Apr | 0.00 | 0.00 | 0.00 |
| May | 0.00 | 0.00 | 0.00 |
| Jun | 0.00 | 0.00 | 0.00 |
| Jul | 0.00 | 0.00 | 0.00 |
| Aug | 0.00 | 0.00 | 0.00 |
| Sep | 0.00 | 0.00 | 0.00 |
| Oct | 0.00 | 0.00 | 0.00 |
| Nov | 0.00 | 0.00 | 0.00 |
| Dec | 0.00 | 0.00 | 0.00 |
| ⌀ Month | 0.00 | 0.00 | 0.00 |