Climate Chart of Isle of Skye, Great Britain
Comprehensive Climate Chart of Isle of Skye, Great Britain: Monthly Averages and Weather Trends
Explore the Weather and Climate of Isle of Skye, Great Britain
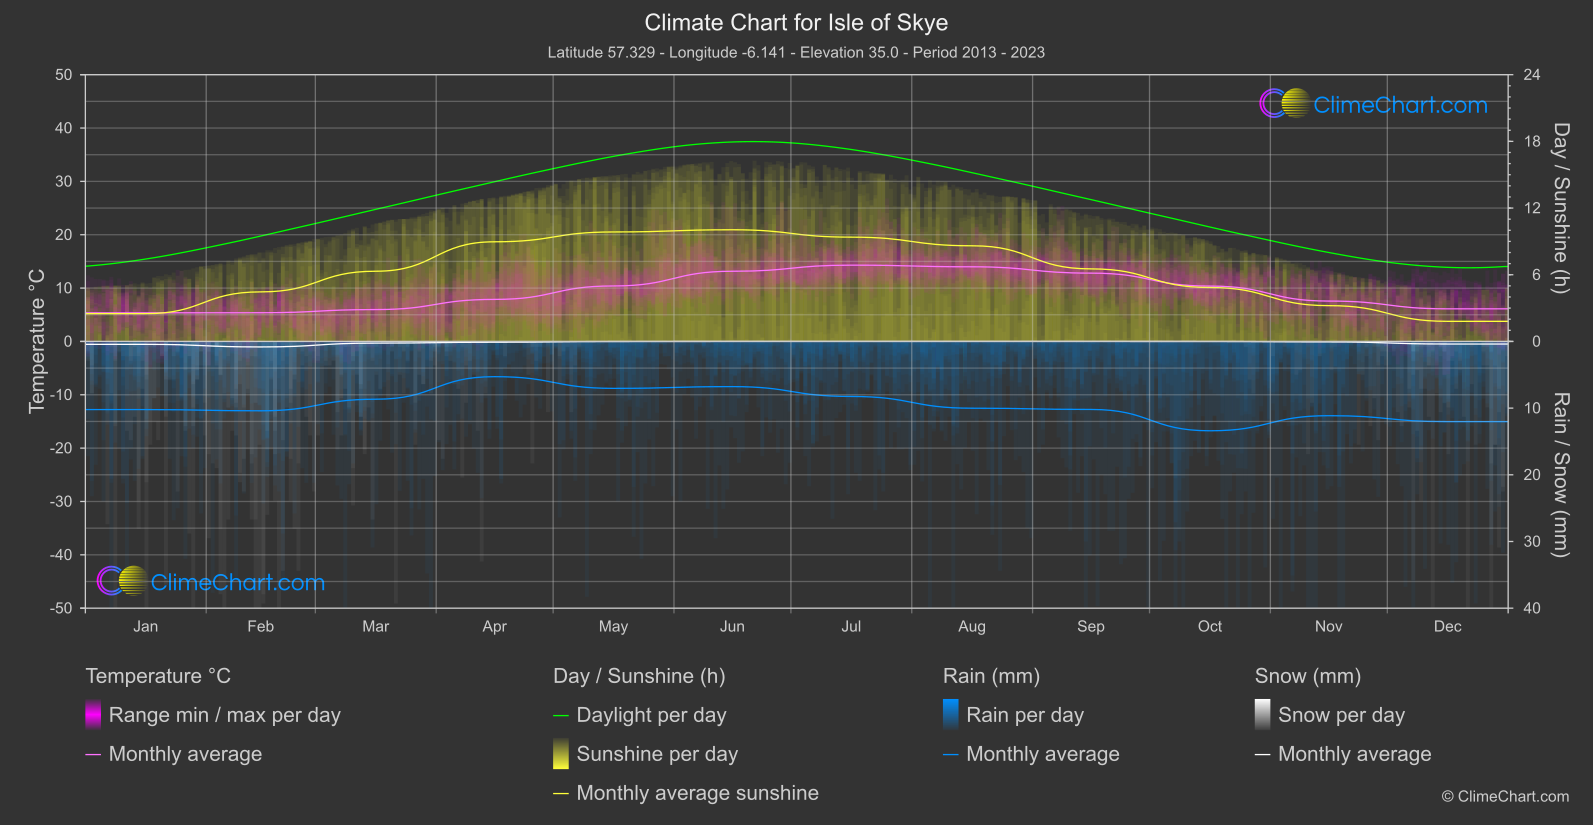
The Isle of Skye in Great Britain experiences a maritime climate with mild winters and cool summers. Rainfall is spread throughout the year, with the wettest months being October and November. Fog is common due to the island's proximity to the sea. Winter temperatures rarely drop below freezing, while summer temperatures seldom exceed 20°C. Visitors can expect changeable weather and should be prepared for sudden shifts in conditions.
Best Travel Time Guide for Isle of Skye, Great Britain: Ideal Seasons and Weather Insights
The best time to visit Isle of Skye is during the summer months of June to August when the weather is relatively mild and the days are longer. However, if you prefer fewer crowds and don't mind cooler temperatures, spring and autumn can also be pleasant times to explore the island. Winter is the least popular time due to the shorter days and colder conditions.
Climate Data Overview for Isle of Skye, Great Britain
Explore the comprehensive climate data for Isle of Skye, Great Britain. This detailed table provides valuable insights into temperature variations, precipitation levels, and seasonal changes, helping you understand the unique weather patterns of this region.
| Month | ⌀ Temperature °C | ⌀ Rain (mm) | ⌀ Snow (mm) | ⌀ Sunshine (h) |
|---|---|---|---|---|
| Jan | 5.4 | 5.11 | 0.22 | 2.50 |
| Feb | 5.4 | 5.20 | 0.41 | 4.46 |
| Mar | 6.0 | 4.33 | 0.13 | 6.32 |
| Apr | 7.9 | 2.64 | 0.06 | 8.96 |
| May | 10.4 | 3.52 | 0.01 | 9.85 |
| Jun | 13.2 | 3.39 | 0.00 | 10.05 |
| Jul | 14.3 | 4.13 | 0.00 | 9.38 |
| Aug | 14.0 | 5.01 | 0.00 | 8.61 |
| Sep | 12.8 | 5.10 | 0.00 | 6.53 |
| Oct | 10.4 | 6.70 | 0.00 | 4.85 |
| Nov | 7.6 | 5.57 | 0.04 | 3.22 |
| Dec | 6.1 | 6.01 | 0.19 | 1.81 |
| ⌀ Month | 9.5 | 4.73 | 0.09 | 6.38 |