Climate Change Chart of Isle of Skye, Great Britain
Comprehensive Climate Change Chart of Isle of Skye, Great Britain: Monthly Averages and Impact Trends
Explore the changing climate patterns in Isle of Skye, United Kingdom of Great Britain and Northern Ireland with insightful data analysis.
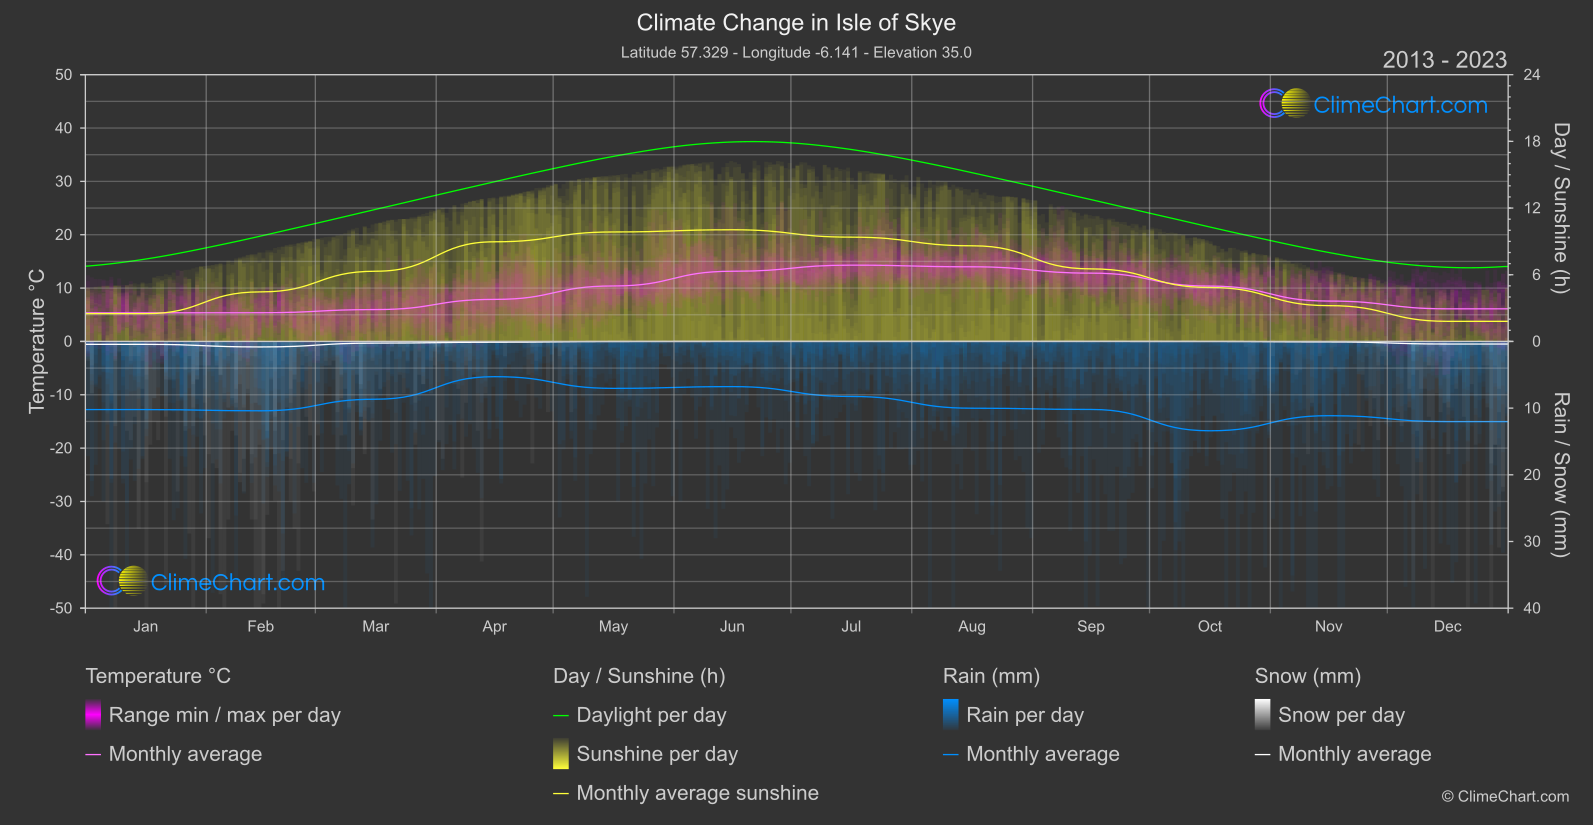
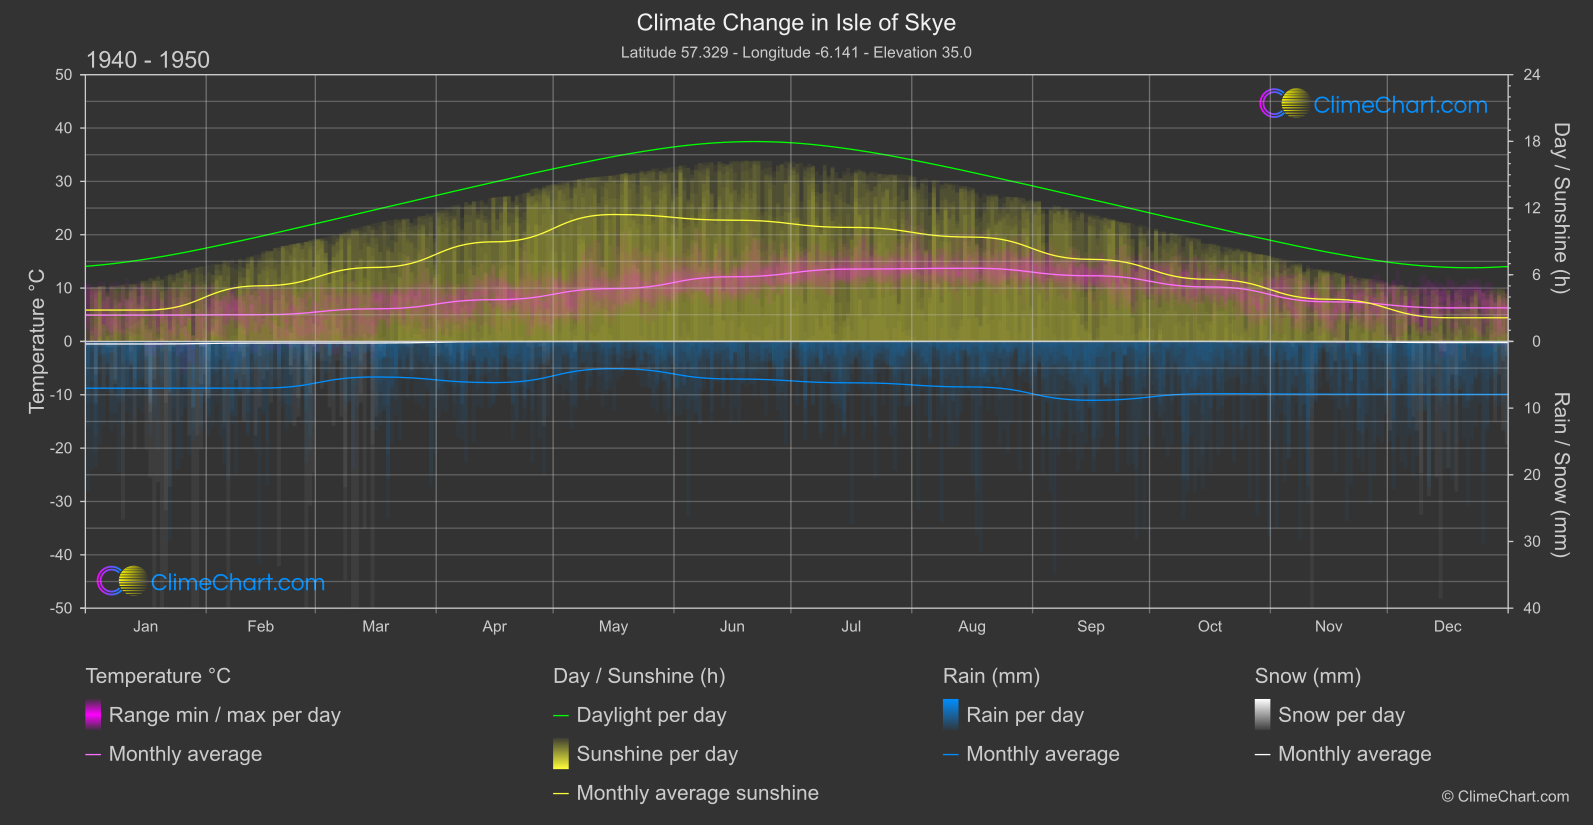
Isle of Skye in the United Kingdom of Great Britain and Northern Ireland experiences notable changes in temperature, rainfall, snowfall, and sunshine duration. Analyzing the data from 1940 - 1950 compared to 2013 - 2024 reveals interesting insights. For example, June shows the highest temperature change of 1.03°C, while October has the greatest increase in rainfall by 2.79 mm. Dive deeper into the climate trends of Isle of Skye with this comprehensive data.
Climate Change Data Overview for Isle of Skye, Great Britain
Explore the comprehensive climate change data for Isle of Skye, Great Britain. This detailed table provides valuable insights into temperature variations, precipitation levels, and seasonal changes influenced by climate change, helping you understand the unique weather patterns of this region.
Temperature °C
| Month | ⌀ 1940 - 1950 | ⌀ 2013 - 2023 | +/- |
|---|---|---|---|
| Jan | 4.92 | 5.36 | 0.44 |
| Feb | 5.01 | 5.38 | 0.37 |
| Mar | 6.11 | 5.97 | -0.14 |
| Apr | 7.83 | 7.88 | 0.05 |
| May | 9.90 | 10.40 | 0.49 |
| Jun | 12.12 | 13.15 | 1.03 |
| Jul | 13.56 | 14.30 | 0.73 |
| Aug | 13.71 | 13.99 | 0.28 |
| Sep | 12.31 | 12.80 | 0.49 |
| Oct | 10.21 | 10.38 | 0.16 |
| Nov | 7.43 | 7.57 | 0.14 |
| Dec | 6.29 | 6.11 | -0.18 |
| ⌀ Month | 9.12 | 9.44 | 0.32 |
Sunshine (h)
| Month | ⌀ 1940 - 1950 | ⌀ 2013 - 2023 | +/- |
|---|---|---|---|
| Jan | 2.82 | 2.50 | -0.32 |
| Feb | 5.01 | 4.46 | -0.55 |
| Mar | 6.66 | 6.32 | -0.34 |
| Apr | 8.96 | 8.96 | 0.00 |
| May | 11.42 | 9.85 | -1.57 |
| Jun | 10.91 | 10.05 | -0.86 |
| Jul | 10.26 | 9.38 | -0.87 |
| Aug | 9.39 | 8.61 | -0.78 |
| Sep | 7.39 | 6.53 | -0.86 |
| Oct | 5.58 | 4.85 | -0.73 |
| Nov | 3.80 | 3.22 | -0.58 |
| Dec | 2.13 | 1.81 | -0.32 |
| ⌀ Month | 7.03 | 6.38 | -0.65 |
Rain (mm)
| Month | ⌀ 1940 - 1950 | ⌀ 2013 - 2023 | +/- |
|---|---|---|---|
| Jan | 3.51 | 5.11 | 1.60 |
| Feb | 3.50 | 5.20 | 1.70 |
| Mar | 2.66 | 4.33 | 1.67 |
| Apr | 3.09 | 2.64 | -0.45 |
| May | 2.04 | 3.52 | 1.48 |
| Jun | 2.82 | 3.39 | 0.57 |
| Jul | 3.10 | 4.13 | 1.02 |
| Aug | 3.41 | 5.01 | 1.59 |
| Sep | 4.41 | 5.10 | 0.69 |
| Oct | 3.91 | 6.70 | 2.79 |
| Nov | 3.95 | 5.57 | 1.61 |
| Dec | 3.97 | 6.01 | 2.04 |
| ⌀ Month | 3.36 | 4.73 | 1.36 |
Snow (mm)
| Month | ⌀ 1940 - 1950 | ⌀ 2013 - 2023 | +/- |
|---|---|---|---|
| Jan | 0.19 | 0.22 | 0.03 |
| Feb | 0.12 | 0.41 | 0.29 |
| Mar | 0.12 | 0.13 | 0.01 |
| Apr | 0.01 | 0.06 | 0.05 |
| May | 0.00 | 0.01 | 0.01 |
| Jun | 0.00 | 0.00 | 0.00 |
| Jul | 0.00 | 0.00 | 0.00 |
| Aug | 0.00 | 0.00 | 0.00 |
| Sep | 0.00 | 0.00 | 0.00 |
| Oct | 0.00 | 0.00 | 0.00 |
| Nov | 0.02 | 0.04 | 0.01 |
| Dec | 0.09 | 0.19 | 0.11 |
| ⌀ Month | 0.05 | 0.09 | 0.04 |