Climate Chart of Guadalajara, Mexico
Comprehensive Climate Chart of Guadalajara, Mexico: Monthly Averages and Weather Trends
Discover the climate of Guadalajara, Mexico
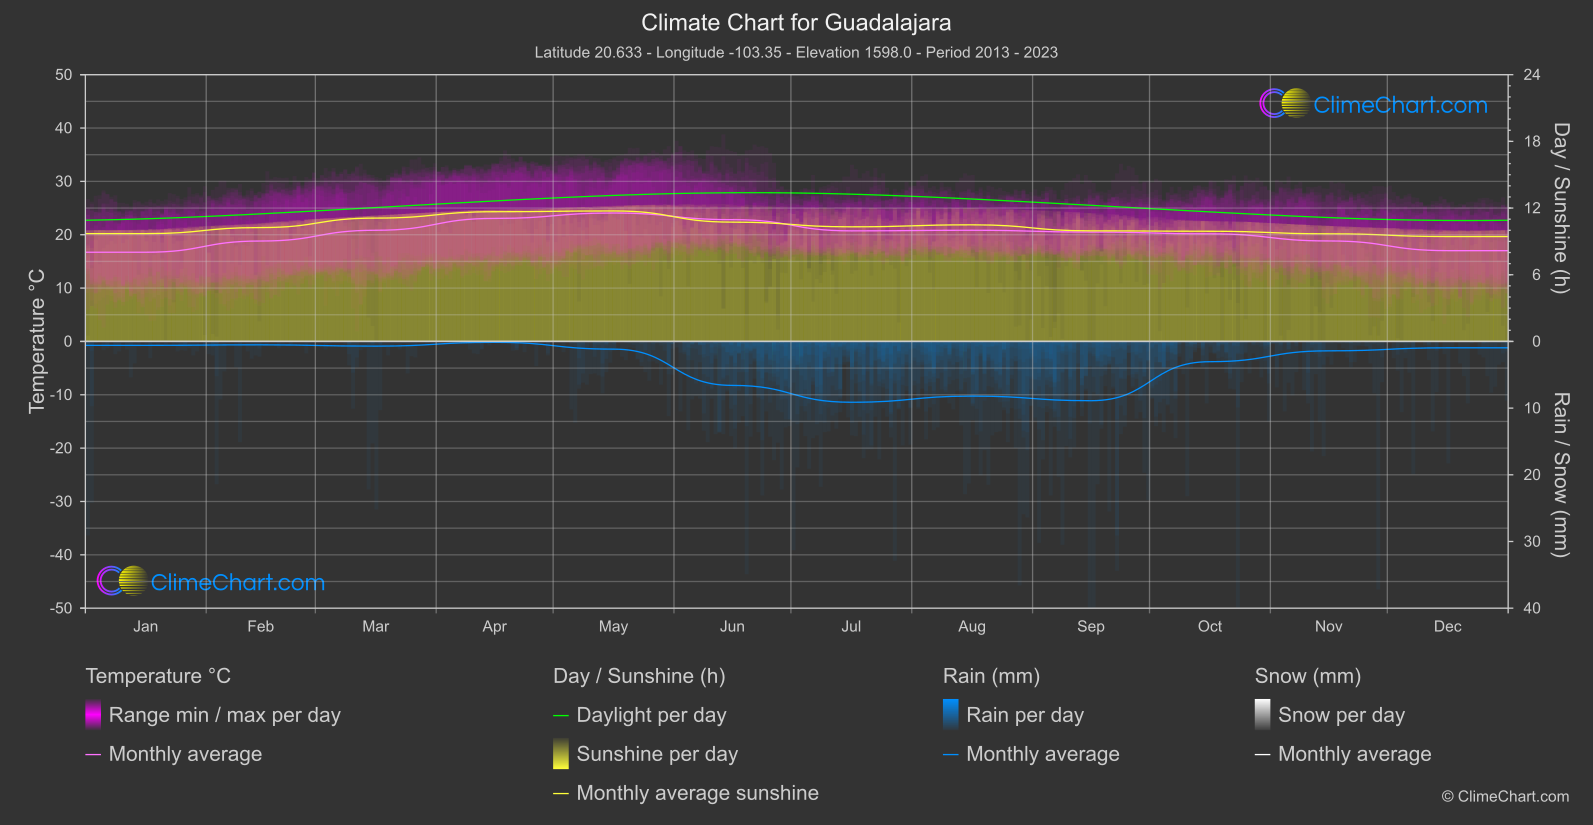
Guadalajara, Mexico, has a subtropical highland climate with dry, warm winters and hot, wet summers. The average annual temperature is around 66°F (19°C). The rainy season typically runs from June to September, with July being the wettest month. The city enjoys plenty of sunshine throughout the year, making it a popular destination for visitors seeking pleasant weather.
Best Travel Time Guide for Guadalajara, Mexico: Ideal Seasons and Weather Insights
The best time to travel to Guadalajara is during the dry season from November to April when temperatures are milder, and there is less chance of rainfall. This period is ideal for exploring the city's attractions and enjoying outdoor activities. However, Guadalajara hosts various cultural events and festivals throughout the year, so any time can be a good time to visit depending on your interests.
Climate Data Overview for Guadalajara, Mexico
Explore the comprehensive climate data for Guadalajara, Mexico. This detailed table provides valuable insights into temperature variations, precipitation levels, and seasonal changes, helping you understand the unique weather patterns of this region.
| Month | ⌀ Temperature °C | ⌀ Rain (mm) | ⌀ Snow (mm) | ⌀ Sunshine (h) |
|---|---|---|---|---|
| Jan | 16.7 | 0.29 | 0.00 | 9.70 |
| Feb | 18.8 | 0.26 | 0.00 | 10.25 |
| Mar | 20.8 | 0.35 | 0.00 | 11.10 |
| Apr | 23.1 | 0.07 | 0.00 | 11.67 |
| May | 24.1 | 0.58 | 0.00 | 11.74 |
| Jun | 22.8 | 3.30 | 0.00 | 10.73 |
| Jul | 20.7 | 4.56 | 0.00 | 10.31 |
| Aug | 20.8 | 4.10 | 0.00 | 10.49 |
| Sep | 20.5 | 4.44 | 0.00 | 9.95 |
| Oct | 20.2 | 1.52 | 0.00 | 9.91 |
| Nov | 18.8 | 0.71 | 0.00 | 9.68 |
| Dec | 17.0 | 0.48 | 0.00 | 9.44 |
| ⌀ Month | 20.4 | 1.72 | 0.00 | 10.41 |