Climate Change Chart of Guadalajara, Mexico
Comprehensive Climate Change Chart of Guadalajara, Mexico: Monthly Averages and Impact Trends
Explore the changing climate in Guadalajara, Mexico with insightful data analysis. Discover how temperature, rainfall, and sunshine duration have evolved over time.
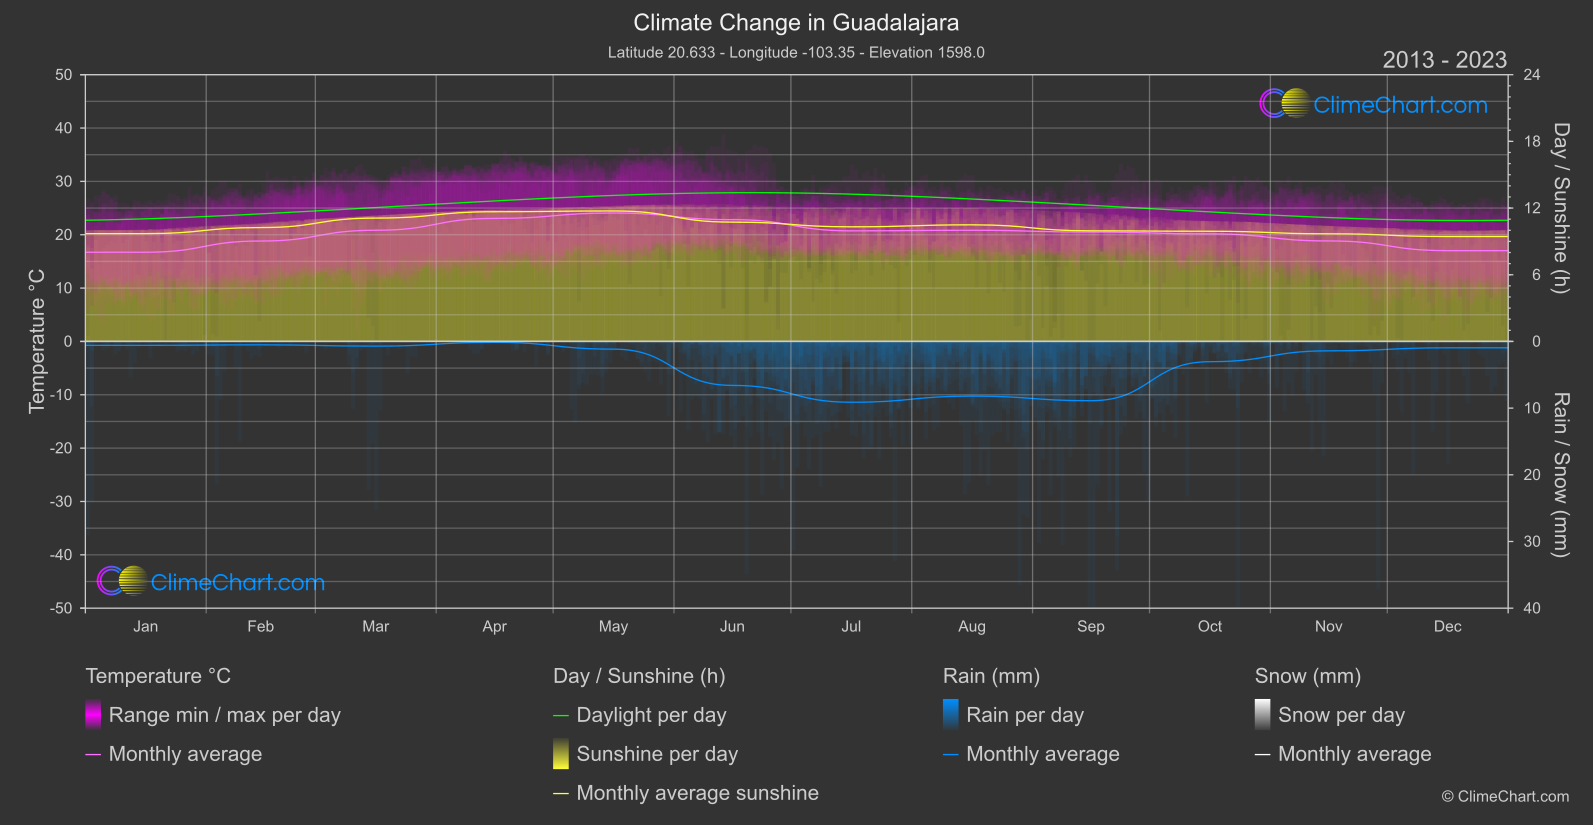
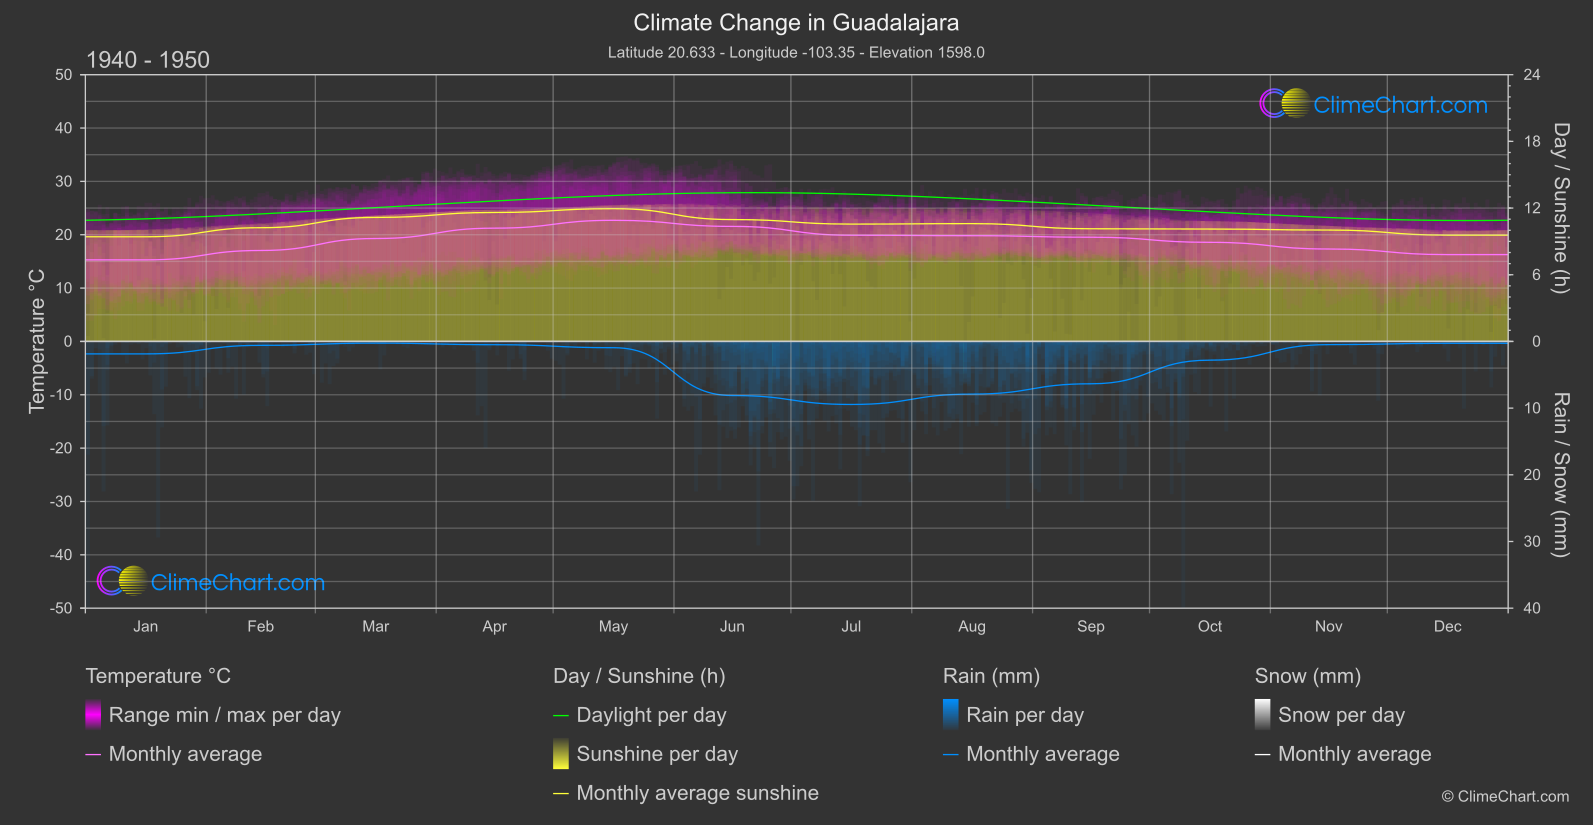
Guadalajara, Mexico, has experienced notable changes in its climate patterns over the years. From January to December, there has been a consistent increase in temperatures from the 1940s to the present decade. The month with the highest temperature change is April, with an increase of approximately 1.82°C. In terms of rainfall, there have been fluctuations with some months showing a decrease in mm of rain, such as January and April, while others like September have seen a significant increase. Sunshine duration has also varied, with some months experiencing a decrease in hours of sunshine compared to the past. These changes highlight the dynamic nature of Guadalajara's climate and the impact of climate change on the region.
Climate Change Data Overview for Guadalajara, Mexico
Explore the comprehensive climate change data for Guadalajara, Mexico. This detailed table provides valuable insights into temperature variations, precipitation levels, and seasonal changes influenced by climate change, helping you understand the unique weather patterns of this region.
Temperature °C
| Month | ⌀ 1940 - 1950 | ⌀ 2013 - 2023 | +/- |
|---|---|---|---|
| Jan | 15.29 | 16.72 | 1.43 |
| Feb | 17.05 | 18.82 | 1.77 |
| Mar | 19.29 | 20.84 | 1.55 |
| Apr | 21.23 | 23.06 | 1.82 |
| May | 22.70 | 24.07 | 1.37 |
| Jun | 21.56 | 22.83 | 1.26 |
| Jul | 19.91 | 20.73 | 0.82 |
| Aug | 19.82 | 20.84 | 1.01 |
| Sep | 19.53 | 20.50 | 0.97 |
| Oct | 18.58 | 20.17 | 1.59 |
| Nov | 17.32 | 18.83 | 1.51 |
| Dec | 16.28 | 17.02 | 0.74 |
| ⌀ Month | 19.05 | 20.37 | 1.32 |
Sunshine (h)
| Month | ⌀ 1940 - 1950 | ⌀ 2013 - 2023 | +/- |
|---|---|---|---|
| Jan | 9.42 | 9.70 | 0.28 |
| Feb | 10.23 | 10.25 | 0.01 |
| Mar | 11.16 | 11.10 | -0.06 |
| Apr | 11.60 | 11.67 | 0.07 |
| May | 11.94 | 11.74 | -0.20 |
| Jun | 10.96 | 10.73 | -0.23 |
| Jul | 10.56 | 10.31 | -0.24 |
| Aug | 10.60 | 10.49 | -0.11 |
| Sep | 10.14 | 9.95 | -0.19 |
| Oct | 10.11 | 9.91 | -0.20 |
| Nov | 10.02 | 9.68 | -0.34 |
| Dec | 9.57 | 9.44 | -0.13 |
| ⌀ Month | 10.53 | 10.41 | -0.11 |
Rain (mm)
| Month | ⌀ 1940 - 1950 | ⌀ 2013 - 2023 | +/- |
|---|---|---|---|
| Jan | 0.93 | 0.29 | -0.64 |
| Feb | 0.29 | 0.26 | -0.04 |
| Mar | 0.13 | 0.35 | 0.23 |
| Apr | 0.25 | 0.07 | -0.18 |
| May | 0.47 | 0.58 | 0.11 |
| Jun | 4.06 | 3.30 | -0.76 |
| Jul | 4.73 | 4.56 | -0.17 |
| Aug | 3.95 | 4.10 | 0.15 |
| Sep | 3.18 | 4.44 | 1.27 |
| Oct | 1.40 | 1.52 | 0.11 |
| Nov | 0.24 | 0.71 | 0.47 |
| Dec | 0.14 | 0.48 | 0.34 |
| ⌀ Month | 1.65 | 1.72 | 0.07 |
Snow (mm)
| Month | ⌀ 1940 - 1950 | ⌀ 2013 - 2023 | +/- |
|---|---|---|---|
| Jan | 0.00 | 0.00 | 0.00 |
| Feb | 0.00 | 0.00 | 0.00 |
| Mar | 0.00 | 0.00 | 0.00 |
| Apr | 0.00 | 0.00 | 0.00 |
| May | 0.00 | 0.00 | 0.00 |
| Jun | 0.00 | 0.00 | 0.00 |
| Jul | 0.00 | 0.00 | 0.00 |
| Aug | 0.00 | 0.00 | 0.00 |
| Sep | 0.00 | 0.00 | 0.00 |
| Oct | 0.00 | 0.00 | 0.00 |
| Nov | 0.00 | 0.00 | 0.00 |
| Dec | 0.00 | 0.00 | 0.00 |
| ⌀ Month | 0.00 | 0.00 | 0.00 |