Climate Chart of Death Valley National Park, USA
Comprehensive Climate Chart of Death Valley National Park, USA: Monthly Averages and Weather Trends
Welcome to Death Valley National Park, USA. Explore the extremes of nature in this unique desert landscape.
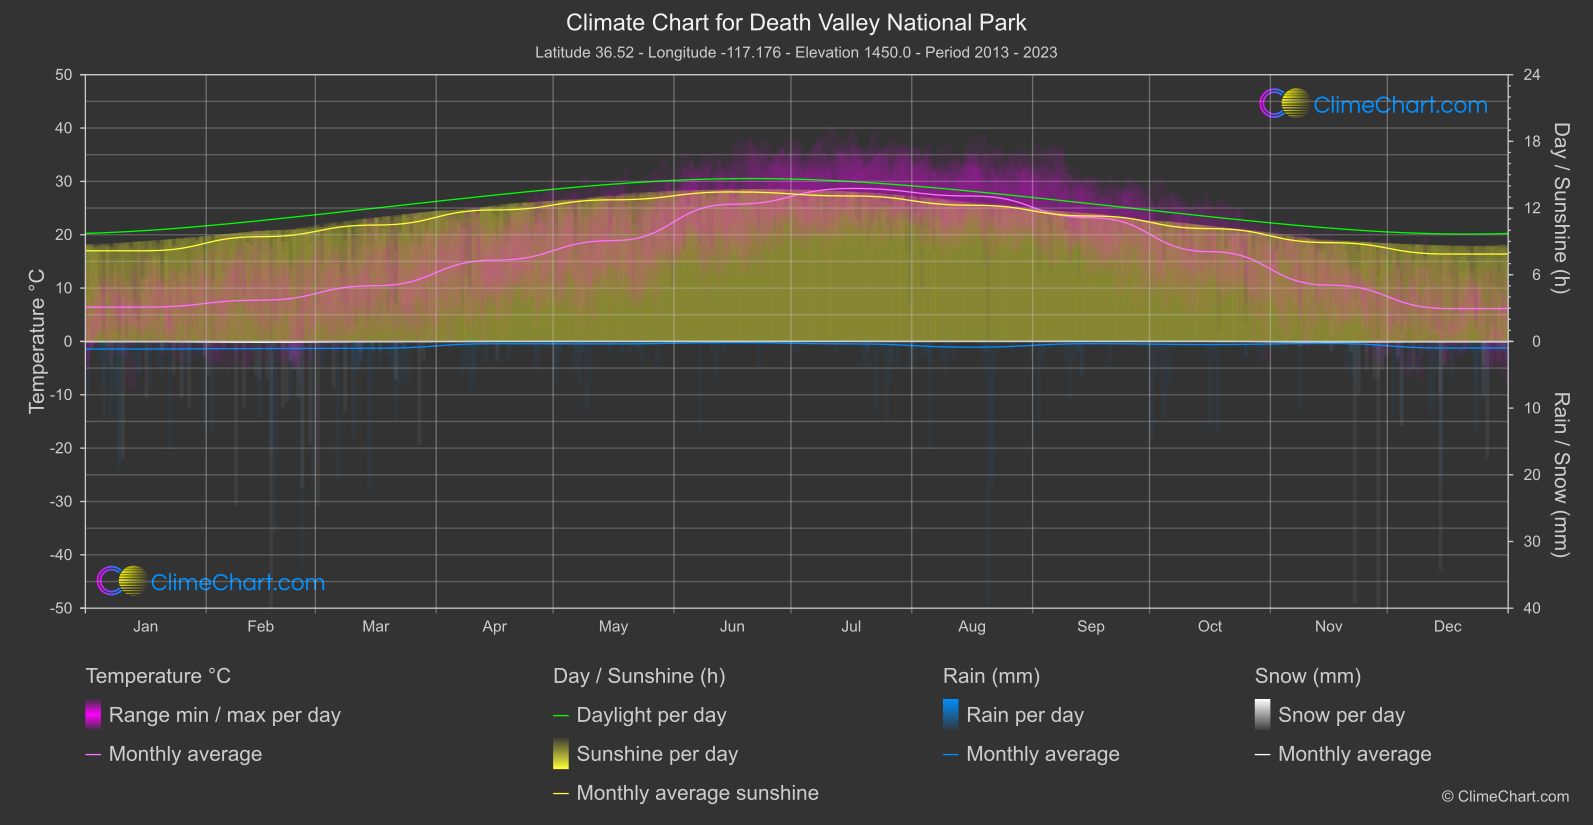
Death Valley National Park, located in California, is known for its extreme climate. Summers are scorching hot with temperatures exceeding 120°F (49°C) while winters can be cold. The park receives minimal rainfall, making it one of the driest places in North America. The unique desert flora and stunning landscapes attract visitors from around the world.
Best Travel Time Guide for Death Valley National Park, USA: Ideal Seasons and Weather Insights
The best time to visit Death Valley National Park is in the fall and spring when temperatures are milder. Summer can be extremely hot, so it's advisable to avoid visiting during this season. Winter offers cooler temperatures but be prepared for chilly nights. Plan your trip accordingly to make the most of your visit to this unique desert destination.
Climate Data Overview for Death Valley National Park, USA
Explore the comprehensive climate data for Death Valley National Park, USA. This detailed table provides valuable insights into temperature variations, precipitation levels, and seasonal changes, helping you understand the unique weather patterns of this region.
| Month | ⌀ Temperature °C | ⌀ Rain (mm) | ⌀ Snow (mm) | ⌀ Sunshine (h) |
|---|---|---|---|---|
| Jan | 6.4 | 0.57 | 0.02 | 8.16 |
| Feb | 7.7 | 0.54 | 0.06 | 9.43 |
| Mar | 10.4 | 0.51 | 0.02 | 10.47 |
| Apr | 15.2 | 0.17 | 0.00 | 11.83 |
| May | 18.9 | 0.18 | 0.00 | 12.74 |
| Jun | 25.7 | 0.09 | 0.00 | 13.45 |
| Jul | 28.7 | 0.18 | 0.00 | 13.09 |
| Aug | 27.3 | 0.43 | 0.00 | 12.25 |
| Sep | 23.2 | 0.17 | 0.00 | 11.28 |
| Oct | 16.8 | 0.23 | 0.00 | 10.15 |
| Nov | 10.6 | 0.15 | 0.04 | 8.89 |
| Dec | 6.2 | 0.50 | 0.03 | 7.86 |
| ⌀ Month | 16.4 | 0.31 | 0.01 | 10.80 |