Climate Change Chart of Death Valley National Park, USA
Comprehensive Climate Change Chart of Death Valley National Park, USA: Monthly Averages and Impact Trends
Explore the changing climate in Death Valley National Park, USA, through detailed data analysis. Discover the trends in temperature, rainfall, snowfall, and sunshine duration from 1940 - 1950 compared to 2013 - 2024.
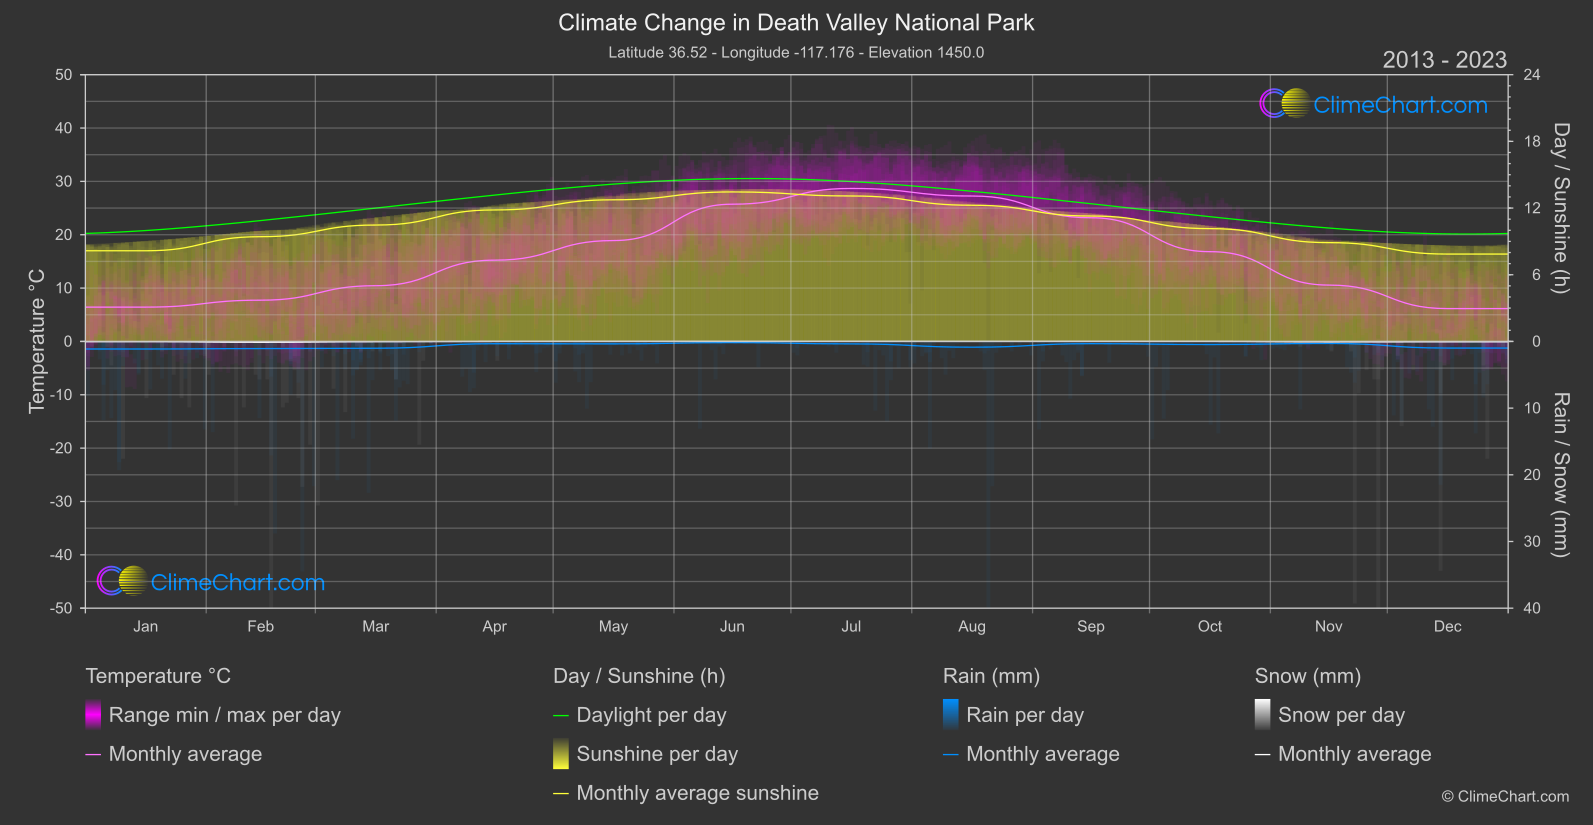
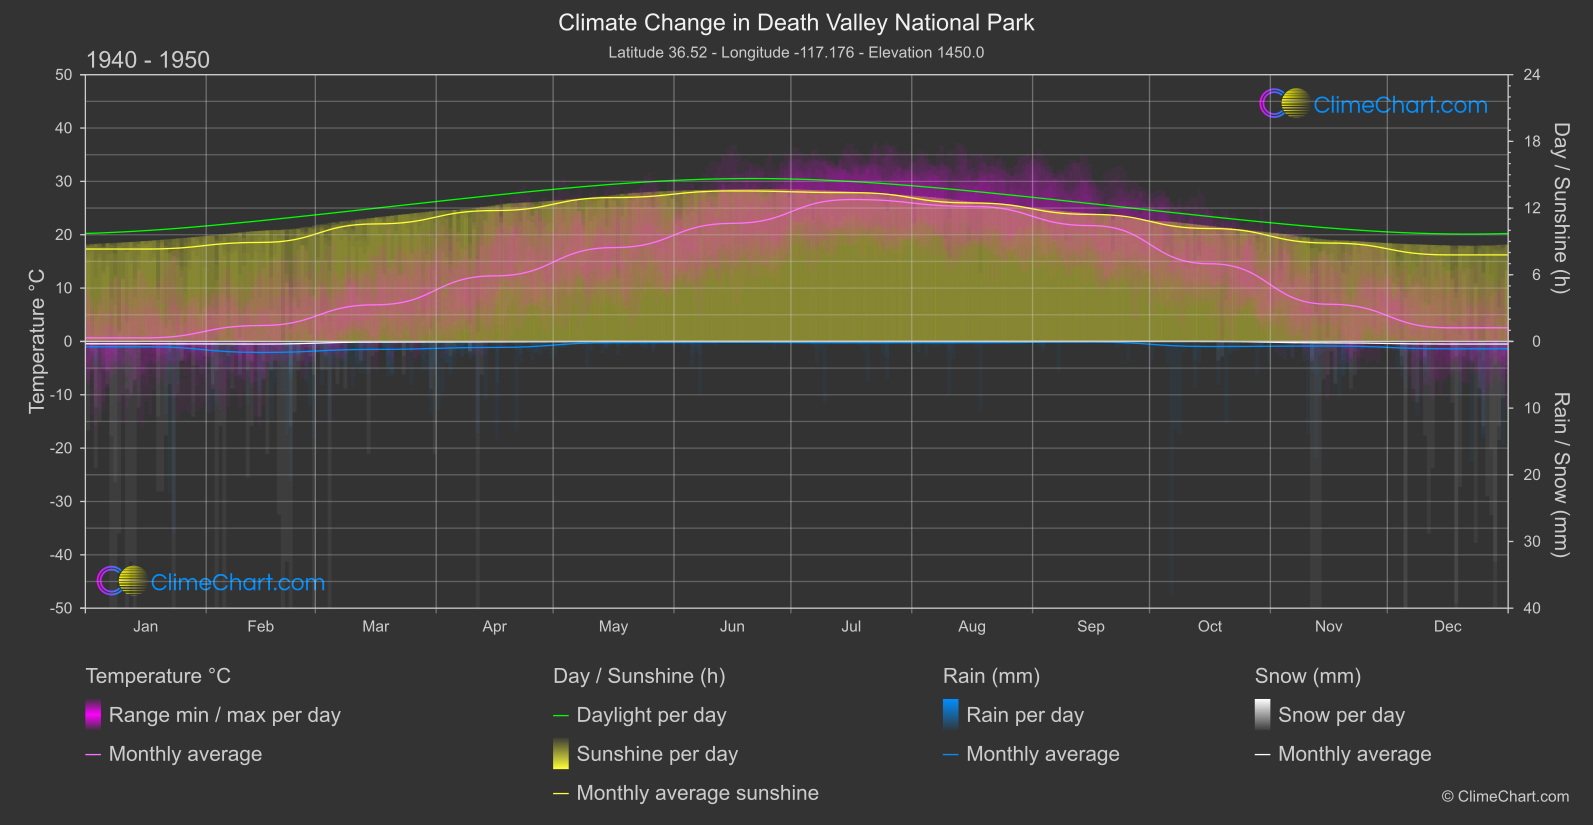
Death Valley National Park in the USA has experienced significant changes in climate over the years. Analyzing the data from 1940 - 1950 compared to 2013 - 2024 reveals interesting insights. The month with the highest temperature change is June, with a substantial increase of 3.59°C. In terms of rainfall, the month with the most significant change is August, showing a rise of 0.34mm. Snowfall has decreased overall, with notable reductions in January and December. Sunshine duration has also seen fluctuations, with July experiencing the largest decrease of 0.30 hours. These changes highlight the impact of climate change on the weather patterns in Death Valley National Park.
Climate Change Data Overview for Death Valley National Park, USA
Explore the comprehensive climate change data for Death Valley National Park, USA. This detailed table provides valuable insights into temperature variations, precipitation levels, and seasonal changes influenced by climate change, helping you understand the unique weather patterns of this region.
Temperature °C
| Month | ⌀ 1940 - 1950 | ⌀ 2013 - 2023 | +/- |
|---|---|---|---|
| Jan | 0.67 | 6.43 | 5.76 |
| Feb | 2.98 | 7.73 | 4.75 |
| Mar | 6.87 | 10.45 | 3.58 |
| Apr | 12.29 | 15.23 | 2.94 |
| May | 17.59 | 18.91 | 1.32 |
| Jun | 22.13 | 25.72 | 3.59 |
| Jul | 26.60 | 28.68 | 2.07 |
| Aug | 25.31 | 27.26 | 1.94 |
| Sep | 21.71 | 23.18 | 1.48 |
| Oct | 14.56 | 16.83 | 2.27 |
| Nov | 6.97 | 10.56 | 3.59 |
| Dec | 2.55 | 6.15 | 3.60 |
| ⌀ Month | 13.35 | 16.43 | 3.07 |
Sunshine (h)
| Month | ⌀ 1940 - 1950 | ⌀ 2013 - 2023 | +/- |
|---|---|---|---|
| Jan | 8.31 | 8.16 | -0.16 |
| Feb | 8.91 | 9.43 | 0.52 |
| Mar | 10.57 | 10.47 | -0.10 |
| Apr | 11.78 | 11.83 | 0.06 |
| May | 12.94 | 12.74 | -0.20 |
| Jun | 13.54 | 13.45 | -0.09 |
| Jul | 13.39 | 13.09 | -0.30 |
| Aug | 12.46 | 12.25 | -0.21 |
| Sep | 11.43 | 11.28 | -0.15 |
| Oct | 10.16 | 10.15 | -0.01 |
| Nov | 8.85 | 8.89 | 0.04 |
| Dec | 7.79 | 7.86 | 0.07 |
| ⌀ Month | 10.84 | 10.80 | -0.04 |
Rain (mm)
| Month | ⌀ 1940 - 1950 | ⌀ 2013 - 2023 | +/- |
|---|---|---|---|
| Jan | 0.40 | 0.57 | 0.17 |
| Feb | 0.83 | 0.54 | -0.29 |
| Mar | 0.60 | 0.51 | -0.09 |
| Apr | 0.45 | 0.17 | -0.28 |
| May | 0.09 | 0.18 | 0.09 |
| Jun | 0.07 | 0.09 | 0.02 |
| Jul | 0.10 | 0.18 | 0.09 |
| Aug | 0.09 | 0.43 | 0.34 |
| Sep | 0.05 | 0.17 | 0.12 |
| Oct | 0.38 | 0.23 | -0.15 |
| Nov | 0.34 | 0.15 | -0.19 |
| Dec | 0.55 | 0.50 | -0.05 |
| ⌀ Month | 0.33 | 0.31 | -0.02 |
Snow (mm)
| Month | ⌀ 1940 - 1950 | ⌀ 2013 - 2023 | +/- |
|---|---|---|---|
| Jan | 0.18 | 0.02 | -0.16 |
| Feb | 0.20 | 0.06 | -0.13 |
| Mar | 0.05 | 0.02 | -0.03 |
| Apr | 0.03 | 0.00 | -0.03 |
| May | 0.00 | 0.00 | 0.00 |
| Jun | 0.00 | 0.00 | 0.00 |
| Jul | 0.00 | 0.00 | 0.00 |
| Aug | 0.00 | 0.00 | 0.00 |
| Sep | 0.00 | 0.00 | 0.00 |
| Oct | 0.00 | 0.00 | -0.00 |
| Nov | 0.11 | 0.04 | -0.07 |
| Dec | 0.20 | 0.03 | -0.17 |
| ⌀ Month | 0.06 | 0.01 | -0.05 |