Climate Chart of Da Nang, Viet Nam
Comprehensive Climate Chart of Da Nang, Viet Nam: Monthly Averages and Weather Trends
Discover the climate of Da Nang, Vietnam
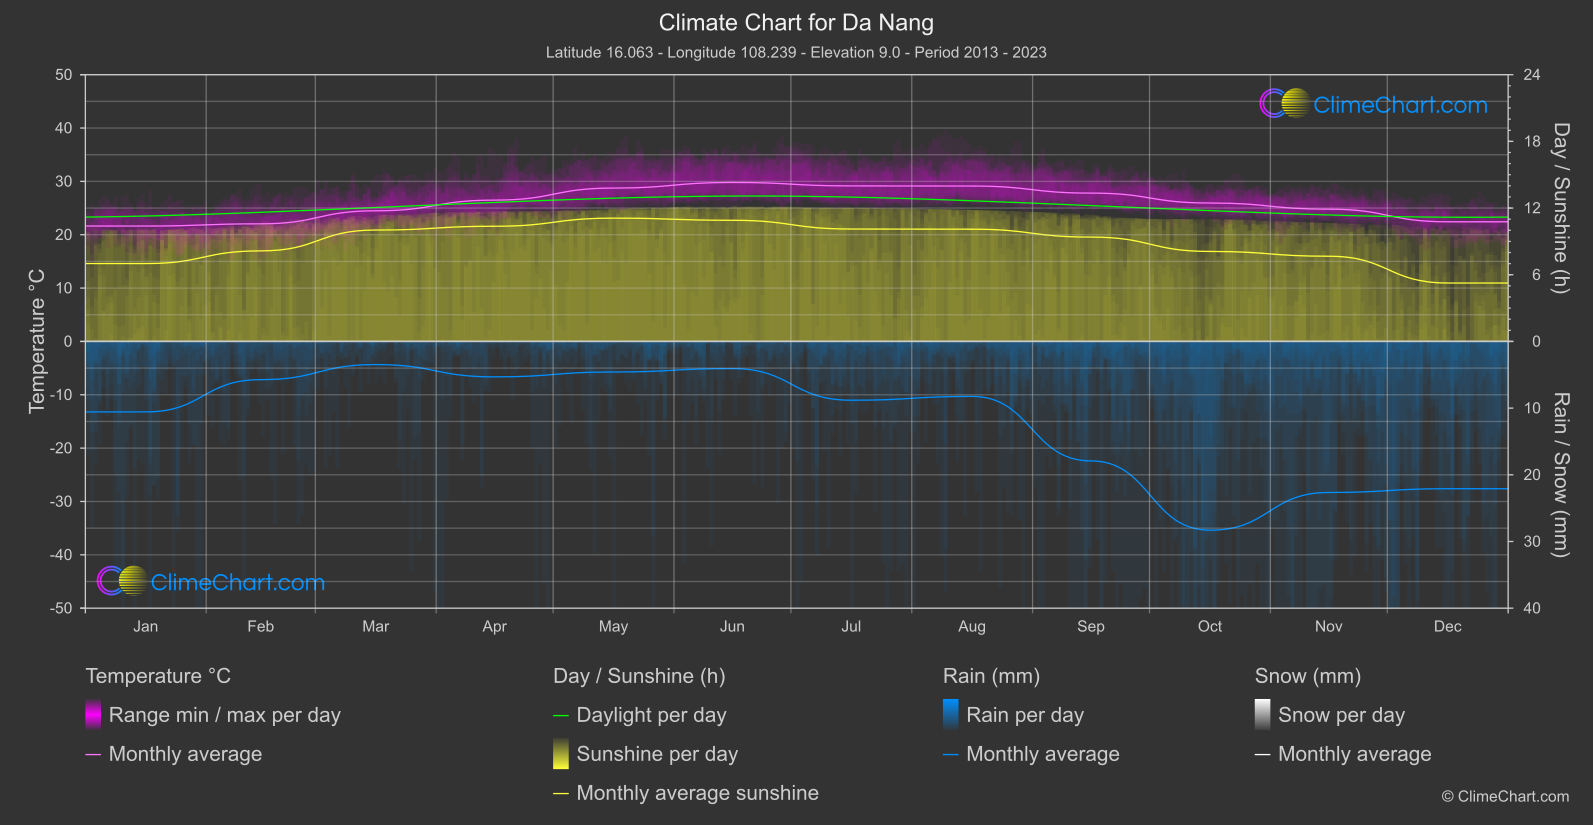
Da Nang, located in central Vietnam, experiences a tropical monsoon climate with two distinct seasons. The rainy season lasts from September to March, with the heaviest rainfall occurring between October and December. The dry season, from April to August, sees plenty of sunshine and warm temperatures. The average annual temperature in Da Nang is around 25 degrees Celsius.
Best Travel Time Guide for Da Nang, Viet Nam: Ideal Seasons and Weather Insights
The best time to travel to Da Nang is during the dry season from April to August when the weather is sunny and pleasant. This period is perfect for enjoying the beautiful beaches and exploring the city without the risk of heavy rainfall. For those who prefer cooler temperatures, visiting in the early part of the dry season or late in the rainy season can also be enjoyable.
Climate Data Overview for Da Nang, Viet Nam
Explore the comprehensive climate data for Da Nang, Viet Nam. This detailed table provides valuable insights into temperature variations, precipitation levels, and seasonal changes, helping you understand the unique weather patterns of this region.
| Month | ⌀ Temperature °C | ⌀ Rain (mm) | ⌀ Snow (mm) | ⌀ Sunshine (h) |
|---|---|---|---|---|
| Jan | 21.6 | 5.28 | 0.00 | 7.01 |
| Feb | 22.0 | 2.87 | 0.00 | 8.15 |
| Mar | 24.5 | 1.74 | 0.00 | 10.02 |
| Apr | 26.5 | 2.66 | 0.00 | 10.36 |
| May | 28.7 | 2.29 | 0.00 | 11.09 |
| Jun | 29.8 | 2.04 | 0.00 | 10.90 |
| Jul | 29.2 | 4.41 | 0.00 | 10.11 |
| Aug | 29.1 | 4.12 | 0.00 | 10.10 |
| Sep | 27.8 | 8.96 | 0.00 | 9.39 |
| Oct | 25.9 | 14.15 | 0.00 | 8.10 |
| Nov | 24.8 | 11.32 | 0.00 | 7.66 |
| Dec | 22.4 | 11.04 | 0.00 | 5.26 |
| ⌀ Month | 26.0 | 5.91 | 0.00 | 9.01 |