Climate Change Chart of Da Nang, Viet Nam
Comprehensive Climate Change Chart of Da Nang, Viet Nam: Monthly Averages and Impact Trends
Exploring the changing climate in Da Nang, Vietnam reveals significant shifts in temperature, rainfall, and sunshine duration over the years. Let's delve into the data to uncover key insights.
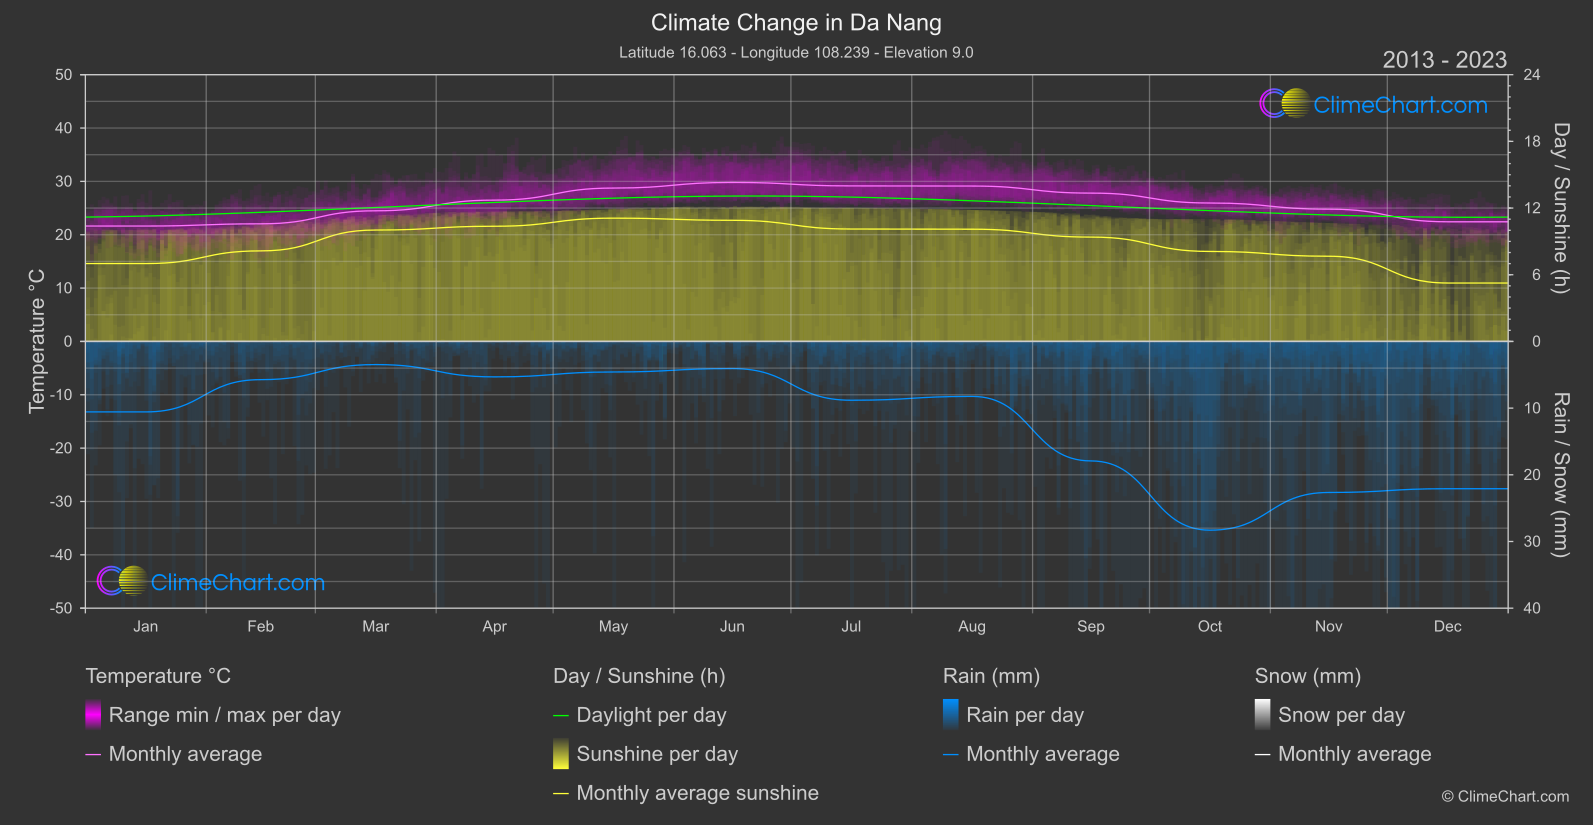
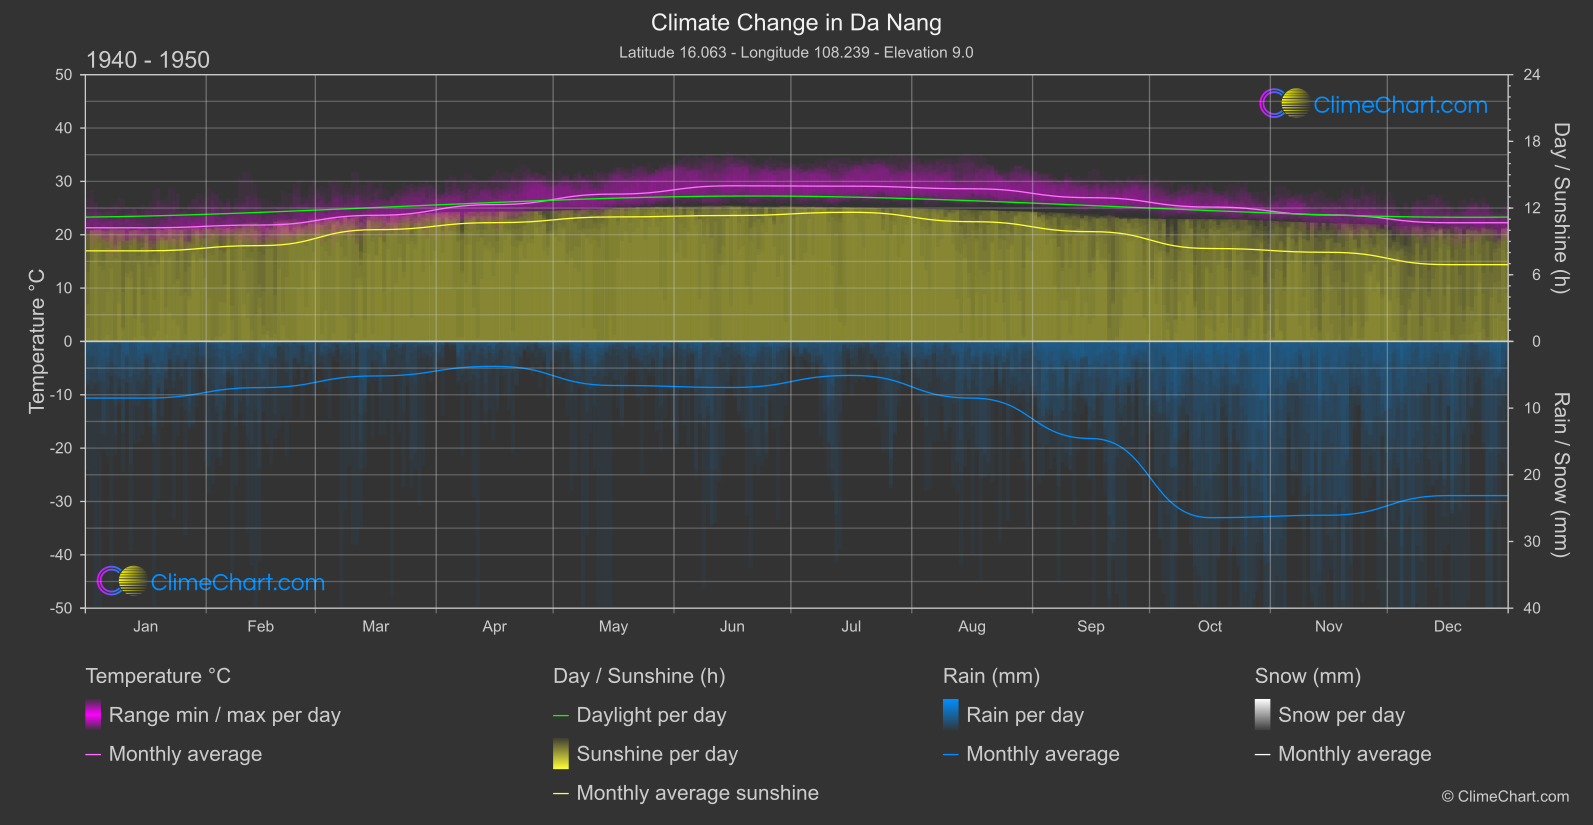
Da Nang, located in central Vietnam, experiences a tropical monsoon climate with distinct wet and dry seasons. The data shows a clear trend of increasing temperatures and shifting rainfall patterns over the years. Notably, May appears to have the highest temperature change, while July has the most significant increase in rainfall. Understanding these changes is crucial for climate adaptation and mitigation efforts.
Climate Change Data Overview for Da Nang, Viet Nam
Explore the comprehensive climate change data for Da Nang, Viet Nam. This detailed table provides valuable insights into temperature variations, precipitation levels, and seasonal changes influenced by climate change, helping you understand the unique weather patterns of this region.
Temperature °C
| Month | ⌀ 1940 - 1950 | ⌀ 2013 - 2023 | +/- |
|---|---|---|---|
| Jan | 21.30 | 21.63 | 0.33 |
| Feb | 21.82 | 22.05 | 0.23 |
| Mar | 23.65 | 24.49 | 0.84 |
| Apr | 25.65 | 26.49 | 0.84 |
| May | 27.62 | 28.75 | 1.13 |
| Jun | 29.17 | 29.80 | 0.63 |
| Jul | 29.10 | 29.15 | 0.05 |
| Aug | 28.61 | 29.13 | 0.51 |
| Sep | 26.95 | 27.80 | 0.85 |
| Oct | 25.20 | 25.95 | 0.75 |
| Nov | 23.71 | 24.79 | 1.08 |
| Dec | 22.25 | 22.43 | 0.18 |
| ⌀ Month | 25.42 | 26.04 | 0.62 |
Sunshine (h)
| Month | ⌀ 1940 - 1950 | ⌀ 2013 - 2023 | +/- |
|---|---|---|---|
| Jan | 8.15 | 7.01 | -1.15 |
| Feb | 8.62 | 8.15 | -0.48 |
| Mar | 10.06 | 10.02 | -0.03 |
| Apr | 10.69 | 10.36 | -0.32 |
| May | 11.20 | 11.09 | -0.11 |
| Jun | 11.33 | 10.90 | -0.43 |
| Jul | 11.62 | 10.11 | -1.50 |
| Aug | 10.78 | 10.10 | -0.68 |
| Sep | 9.88 | 9.39 | -0.49 |
| Oct | 8.36 | 8.10 | -0.26 |
| Nov | 8.02 | 7.66 | -0.35 |
| Dec | 6.91 | 5.26 | -1.65 |
| ⌀ Month | 9.63 | 9.01 | -0.62 |
Rain (mm)
| Month | ⌀ 1940 - 1950 | ⌀ 2013 - 2023 | +/- |
|---|---|---|---|
| Jan | 4.25 | 5.28 | 1.04 |
| Feb | 3.46 | 2.87 | -0.60 |
| Mar | 2.59 | 1.74 | -0.85 |
| Apr | 1.87 | 2.66 | 0.79 |
| May | 3.30 | 2.29 | -1.01 |
| Jun | 3.45 | 2.04 | -1.42 |
| Jul | 2.55 | 4.41 | 1.86 |
| Aug | 4.25 | 4.12 | -0.13 |
| Sep | 7.28 | 8.96 | 1.68 |
| Oct | 13.21 | 14.15 | 0.94 |
| Nov | 13.03 | 11.32 | -1.71 |
| Dec | 11.56 | 11.04 | -0.51 |
| ⌀ Month | 5.90 | 5.91 | 0.01 |
Snow (mm)
| Month | ⌀ 1940 - 1950 | ⌀ 2013 - 2023 | +/- |
|---|---|---|---|
| Jan | 0.00 | 0.00 | 0.00 |
| Feb | 0.00 | 0.00 | 0.00 |
| Mar | 0.00 | 0.00 | 0.00 |
| Apr | 0.00 | 0.00 | 0.00 |
| May | 0.00 | 0.00 | 0.00 |
| Jun | 0.00 | 0.00 | 0.00 |
| Jul | 0.00 | 0.00 | 0.00 |
| Aug | 0.00 | 0.00 | 0.00 |
| Sep | 0.00 | 0.00 | 0.00 |
| Oct | 0.00 | 0.00 | 0.00 |
| Nov | 0.00 | 0.00 | 0.00 |
| Dec | 0.00 | 0.00 | 0.00 |
| ⌀ Month | 0.00 | 0.00 | 0.00 |