Climate Chart of Chiang Mai, Thailand
Comprehensive Climate Chart of Chiang Mai, Thailand: Monthly Averages and Weather Trends
Discover the Climate of Chiang Mai, Thailand
Chiang Mai, located in northern Thailand, has a tropical wet and dry climate. The city experiences three distinct seasons: hot season from March to June, rainy season from July to October, and cool season from November to February. Average temperatures range from 25°C to 30°C, with the hottest months being April and May. The rainy season brings heavy showers, while the cool season offers pleasant weather with lower humidity.
Best Travel Time Guide for Chiang Mai, Thailand: Ideal Seasons and Weather Insights
The best time to visit Chiang Mai is during the cool season from November to February when the weather is pleasant and ideal for exploring the city and its surroundings. However, if you enjoy the festive atmosphere, the hot season from March to June coincides with many cultural events and festivals in the region. The rainy season from July to October may bring occasional downpours, but it also offers lush greenery and fewer crowds.
Climate Data Overview for Chiang Mai, Thailand
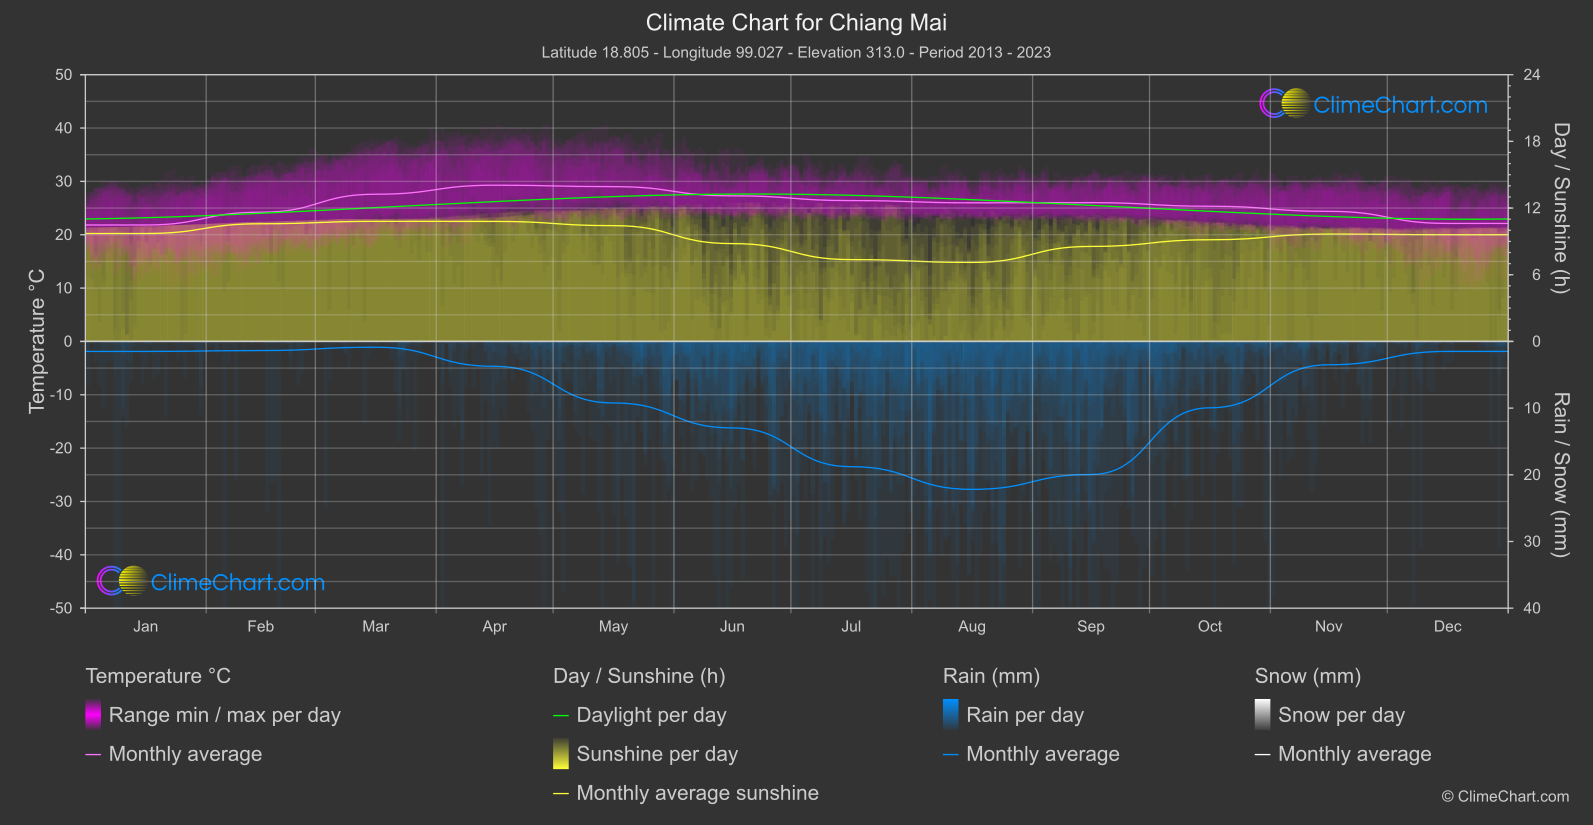
Explore the comprehensive climate data for Chiang Mai, Thailand. This detailed table provides valuable insights into temperature variations, precipitation levels, and seasonal changes, helping you understand the unique weather patterns of this region.
| Month | ⌀ Temperature °C | ⌀ Rain (mm) | ⌀ Snow (mm) | ⌀ Sunshine (h) |
|---|---|---|---|---|
| Jan | 21.8 | 0.75 | 0.00 | 9.71 |
| Feb | 24.2 | 0.69 | 0.00 | 10.59 |
| Mar | 27.6 | 0.43 | 0.00 | 10.80 |
| Apr | 29.3 | 1.87 | 0.00 | 10.80 |
| May | 29.0 | 4.61 | 0.00 | 10.42 |
| Jun | 27.3 | 6.48 | 0.00 | 8.80 |
| Jul | 26.4 | 9.39 | 0.00 | 7.36 |
| Aug | 26.0 | 11.09 | 0.00 | 7.11 |
| Sep | 26.0 | 9.98 | 0.00 | 8.55 |
| Oct | 25.3 | 4.98 | 0.00 | 9.15 |
| Nov | 24.4 | 1.75 | 0.00 | 9.66 |
| Dec | 22.1 | 0.75 | 0.00 | 9.60 |
| ⌀ Month | 25.8 | 4.40 | 0.00 | 9.38 |