Climate Change Chart of Chiang Mai, Thailand
Comprehensive Climate Change Chart of Chiang Mai, Thailand: Monthly Averages and Impact Trends
Exploring the changing climate in Chiang Mai, Thailand reveals intriguing insights into temperature, rainfall, and sunshine duration trends over the years.
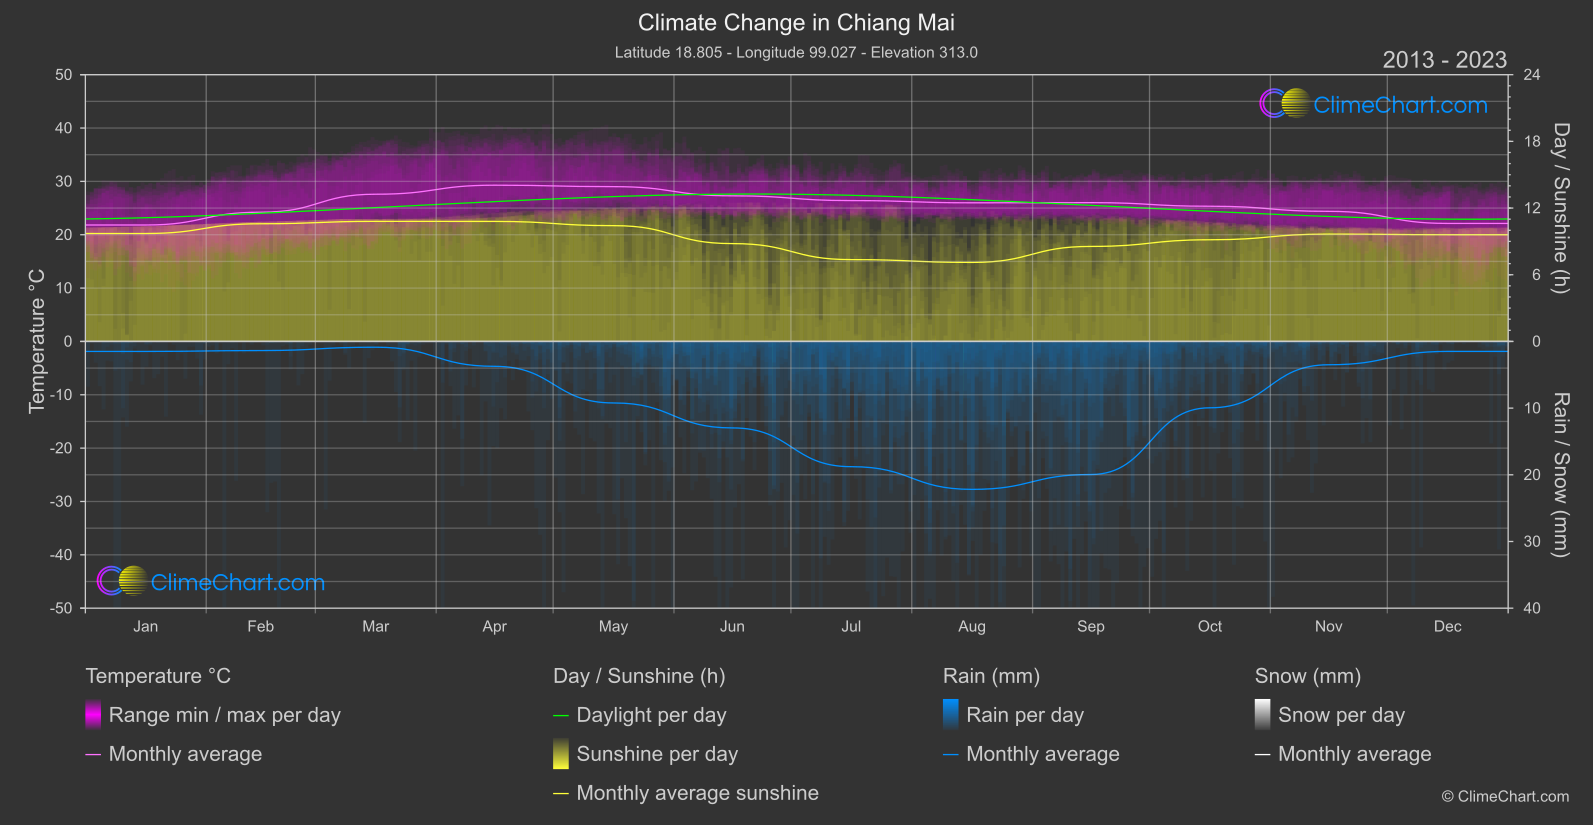
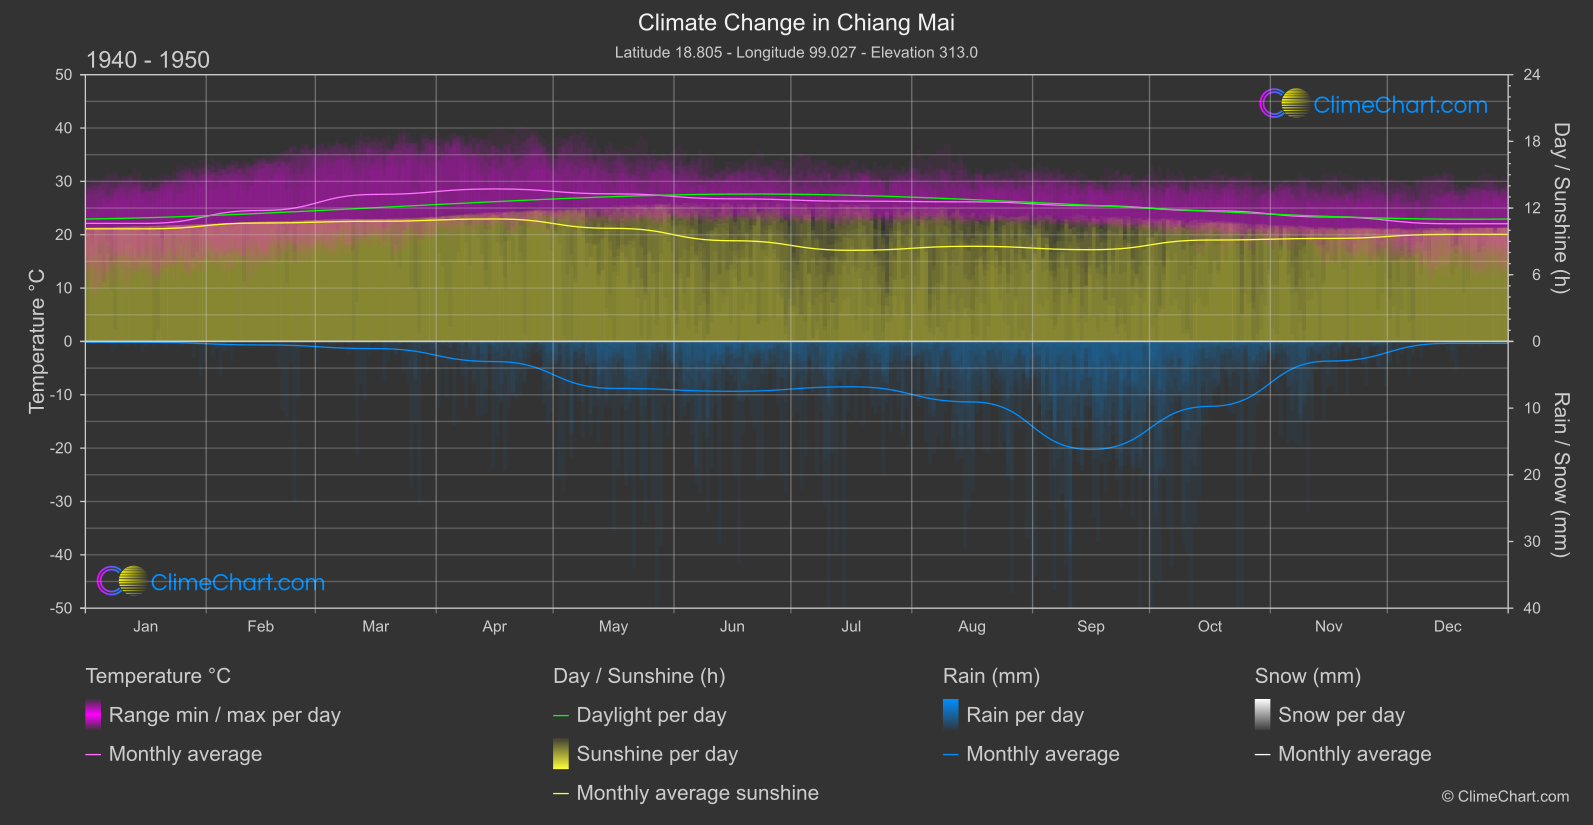
Chiang Mai, known for its unique climate, has shown noticeable changes in temperature, rainfall, and sunshine duration. An analysis of the data indicates that May experiences the highest temperature change with an increase of 1.35°C, while July sees the largest rise in rainfall with a significant increase of 5.99 mm. Moreover, the sunshine duration in August shows a substantial decrease of 1.45 hours compared to previous years.
Climate Change Data Overview for Chiang Mai, Thailand
Explore the comprehensive climate change data for Chiang Mai, Thailand. This detailed table provides valuable insights into temperature variations, precipitation levels, and seasonal changes influenced by climate change, helping you understand the unique weather patterns of this region.
Temperature °C
| Month | ⌀ 1940 - 1950 | ⌀ 2013 - 2023 | +/- |
|---|---|---|---|
| Jan | 22.13 | 21.83 | -0.30 |
| Feb | 24.55 | 24.22 | -0.33 |
| Mar | 27.56 | 27.59 | 0.03 |
| Apr | 28.58 | 29.29 | 0.70 |
| May | 27.66 | 29.02 | 1.35 |
| Jun | 26.73 | 27.29 | 0.56 |
| Jul | 26.29 | 26.40 | 0.11 |
| Aug | 26.16 | 25.98 | -0.18 |
| Sep | 25.44 | 26.01 | 0.57 |
| Oct | 24.50 | 25.34 | 0.84 |
| Nov | 23.33 | 24.38 | 1.06 |
| Dec | 22.06 | 22.12 | 0.06 |
| ⌀ Month | 25.42 | 25.79 | 0.37 |
Sunshine (h)
| Month | ⌀ 1940 - 1950 | ⌀ 2013 - 2023 | +/- |
|---|---|---|---|
| Jan | 10.13 | 9.71 | -0.42 |
| Feb | 10.66 | 10.59 | -0.07 |
| Mar | 10.81 | 10.80 | -0.01 |
| Apr | 11.02 | 10.80 | -0.22 |
| May | 10.17 | 10.42 | 0.24 |
| Jun | 9.06 | 8.80 | -0.26 |
| Jul | 8.20 | 7.36 | -0.84 |
| Aug | 8.56 | 7.11 | -1.45 |
| Sep | 8.25 | 8.55 | 0.29 |
| Oct | 9.12 | 9.15 | 0.02 |
| Nov | 9.26 | 9.66 | 0.39 |
| Dec | 9.63 | 9.60 | -0.03 |
| ⌀ Month | 9.57 | 9.38 | -0.19 |
Rain (mm)
| Month | ⌀ 1940 - 1950 | ⌀ 2013 - 2023 | +/- |
|---|---|---|---|
| Jan | 0.06 | 0.75 | 0.68 |
| Feb | 0.26 | 0.69 | 0.42 |
| Mar | 0.54 | 0.43 | -0.10 |
| Apr | 1.51 | 1.87 | 0.36 |
| May | 3.52 | 4.61 | 1.10 |
| Jun | 3.74 | 6.48 | 2.75 |
| Jul | 3.40 | 9.39 | 5.99 |
| Aug | 4.54 | 11.09 | 6.55 |
| Sep | 8.10 | 9.98 | 1.88 |
| Oct | 4.87 | 4.98 | 0.11 |
| Nov | 1.47 | 1.75 | 0.27 |
| Dec | 0.14 | 0.75 | 0.60 |
| ⌀ Month | 2.68 | 4.40 | 1.72 |
Snow (mm)
| Month | ⌀ 1940 - 1950 | ⌀ 2013 - 2023 | +/- |
|---|---|---|---|
| Jan | 0.00 | 0.00 | 0.00 |
| Feb | 0.00 | 0.00 | 0.00 |
| Mar | 0.00 | 0.00 | 0.00 |
| Apr | 0.00 | 0.00 | 0.00 |
| May | 0.00 | 0.00 | 0.00 |
| Jun | 0.00 | 0.00 | 0.00 |
| Jul | 0.00 | 0.00 | 0.00 |
| Aug | 0.00 | 0.00 | 0.00 |
| Sep | 0.00 | 0.00 | 0.00 |
| Oct | 0.00 | 0.00 | 0.00 |
| Nov | 0.00 | 0.00 | 0.00 |
| Dec | 0.00 | 0.00 | 0.00 |
| ⌀ Month | 0.00 | 0.00 | 0.00 |