Climate Chart of Cheyenne, USA
Comprehensive Climate Chart of Cheyenne, USA: Monthly Averages and Weather Trends
Welcome to Cheyenne, USA - a city known for its diverse climate and unique weather patterns.
Cheyenne experiences a semi-arid climate with four distinct seasons. Summers are warm with occasional thunderstorms, while winters are cold and snowy. Spring and fall offer mild temperatures and colorful foliage. The city receives an average of 60 inches of snow per year and about 15 inches of rainfall. The climate is influenced by its high elevation and proximity to the Rocky Mountains.
Best Travel Time Guide for Cheyenne, USA: Ideal Seasons and Weather Insights
The best time to travel to Cheyenne is during the summer months from June to August when the weather is warm and outdoor activities are abundant. Fall is also a great time to visit for the colorful foliage. Winter can be a magical time to experience the snowy landscapes, but be prepared for cold temperatures. Spring offers blooming flowers and milder weather. Overall, Cheyenne is a destination that can be enjoyed year-round with each season offering a unique experience.
Climate Data Overview for Cheyenne, USA
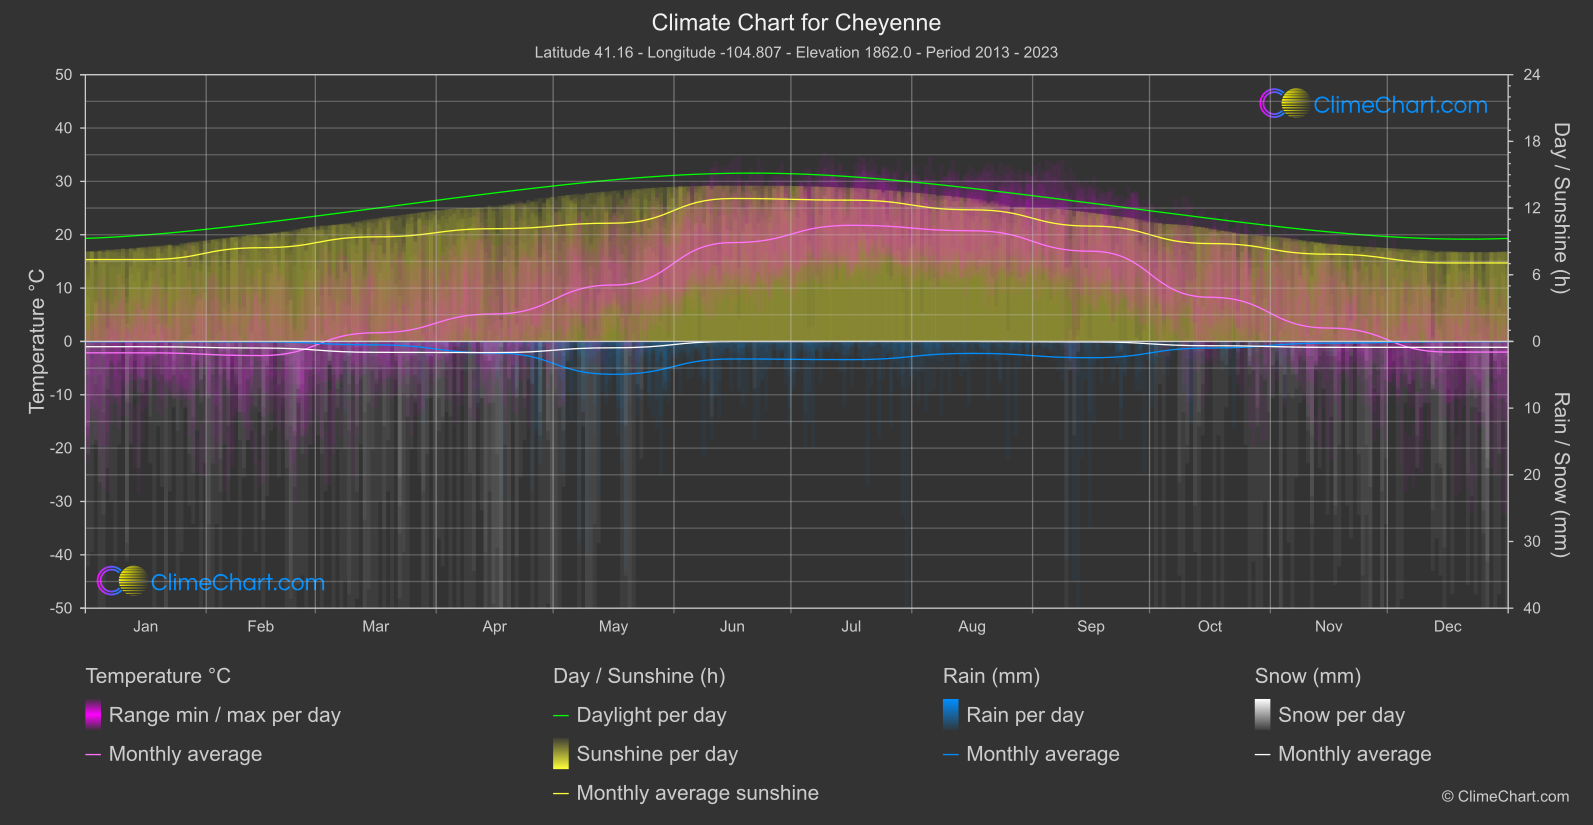
Explore the comprehensive climate data for Cheyenne, USA. This detailed table provides valuable insights into temperature variations, precipitation levels, and seasonal changes, helping you understand the unique weather patterns of this region.
| Month | ⌀ Temperature °C | ⌀ Rain (mm) | ⌀ Snow (mm) | ⌀ Sunshine (h) |
|---|---|---|---|---|
| Jan | -2.1 | 0.02 | 0.40 | 7.37 |
| Feb | -2.6 | 0.03 | 0.49 | 8.43 |
| Mar | 1.6 | 0.26 | 0.82 | 9.41 |
| Apr | 5.2 | 0.87 | 0.84 | 10.14 |
| May | 10.6 | 2.47 | 0.48 | 10.64 |
| Jun | 18.5 | 1.32 | 0.01 | 12.86 |
| Jul | 21.8 | 1.36 | 0.00 | 12.71 |
| Aug | 20.7 | 0.90 | 0.00 | 11.84 |
| Sep | 16.9 | 1.22 | 0.04 | 10.38 |
| Oct | 8.3 | 0.49 | 0.32 | 8.81 |
| Nov | 2.5 | 0.13 | 0.44 | 7.85 |
| Dec | -2.0 | 0.02 | 0.44 | 7.06 |
| ⌀ Month | 8.3 | 0.76 | 0.36 | 9.79 |