Climate Change Chart of Cheyenne, USA
Comprehensive Climate Change Chart of Cheyenne, USA: Monthly Averages and Impact Trends
Explore the changing climate in Cheyenne, USA, with insights from historical data.
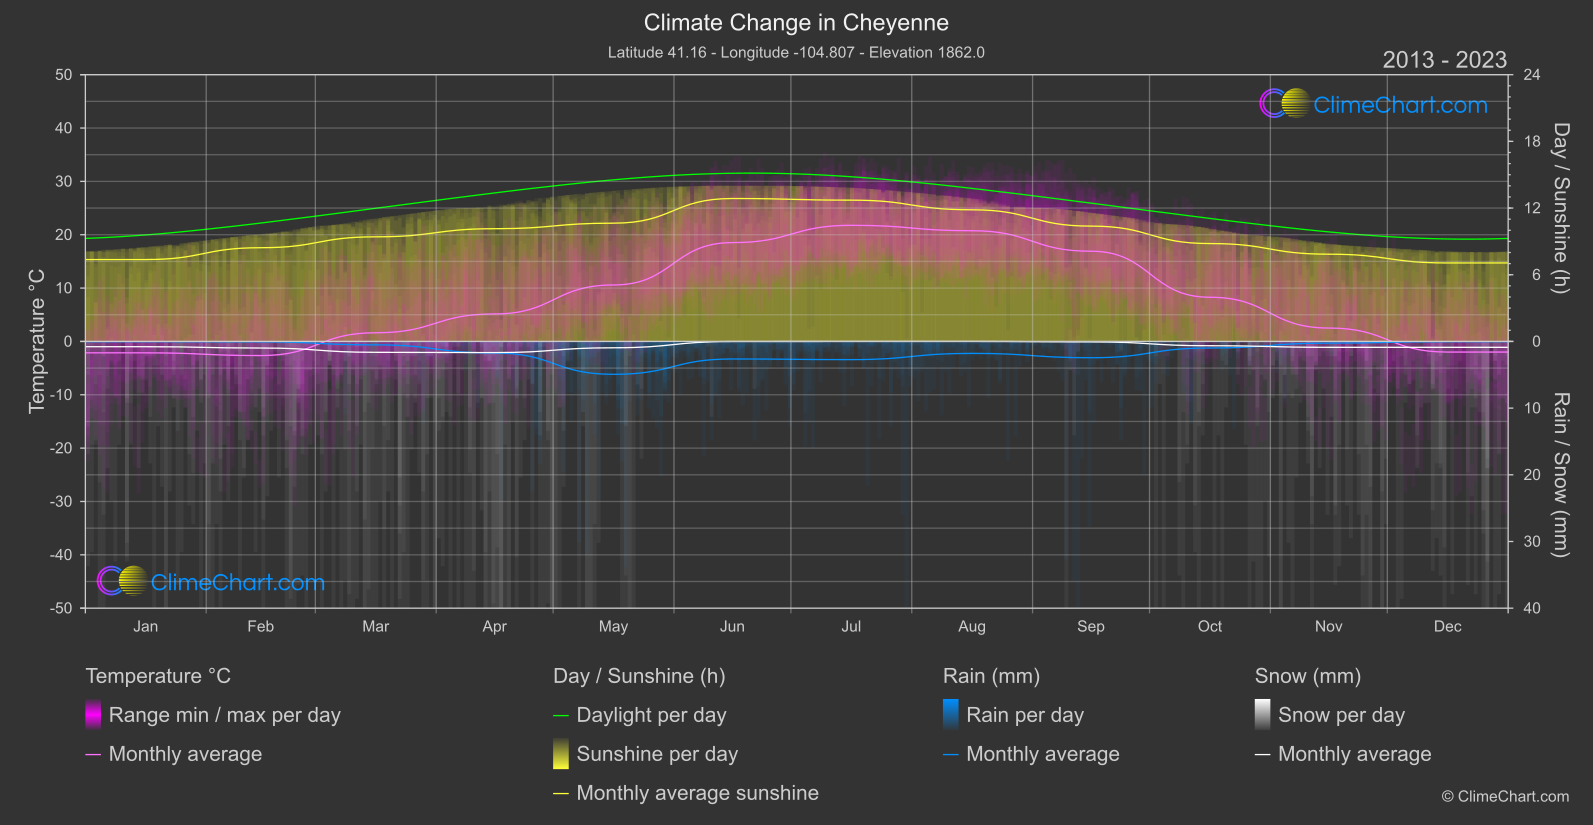
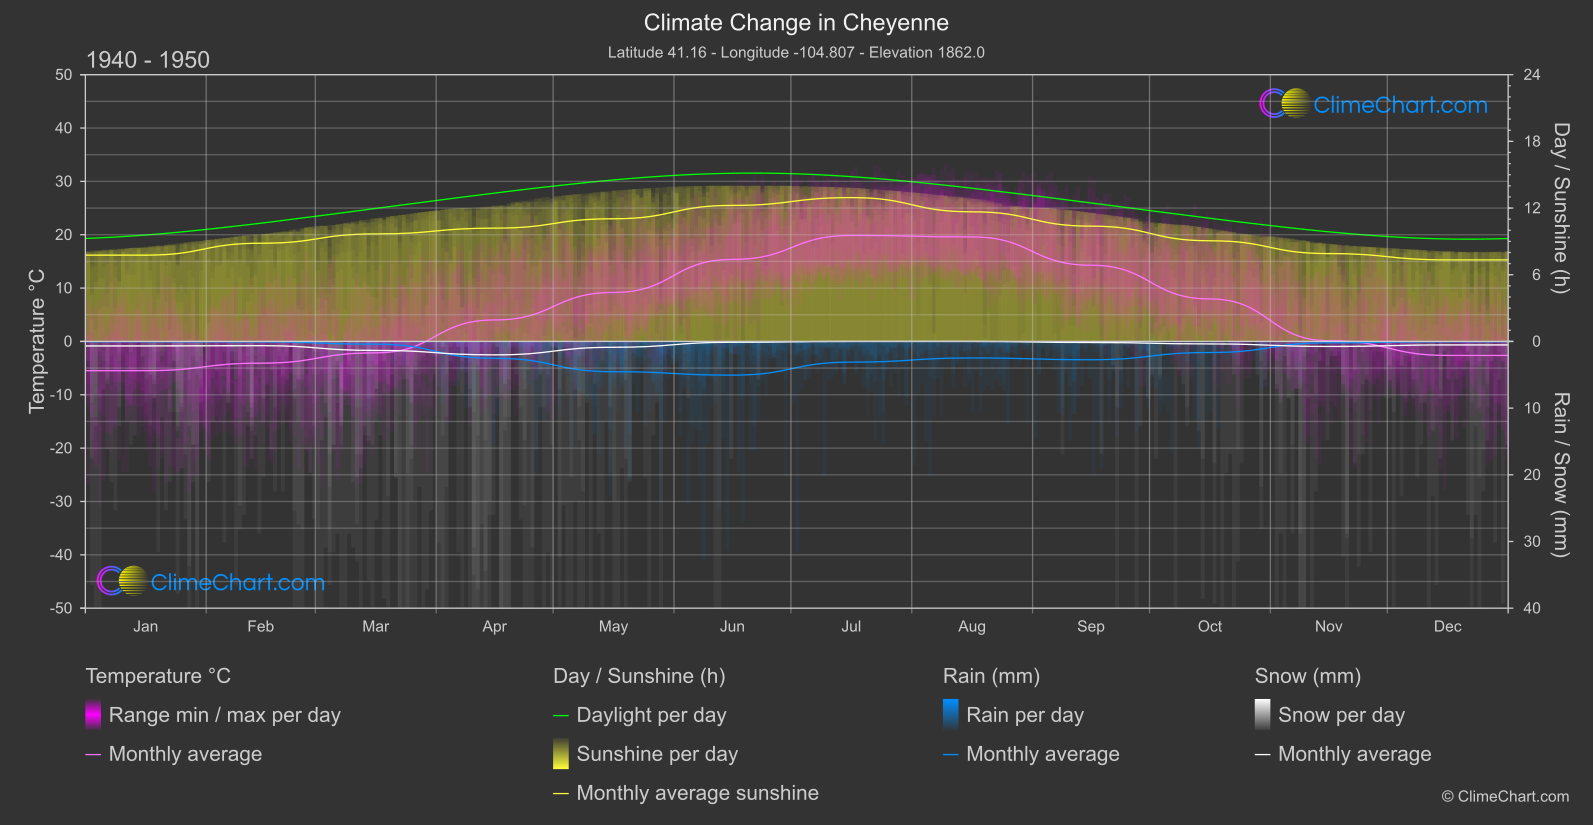
Cheyenne, USA, has experienced notable changes in temperature, rainfall, snowfall, and sunshine duration over the years. Analyzing the data, we find that June has shown the highest temperature increase, while snowfall in December has significantly risen. Additionally, March has seen a considerable uptick in rainfall. These insights reflect the impact of climate change on Cheyenne's weather patterns.
Climate Change Data Overview for Cheyenne, USA
Explore the comprehensive climate change data for Cheyenne, USA. This detailed table provides valuable insights into temperature variations, precipitation levels, and seasonal changes influenced by climate change, helping you understand the unique weather patterns of this region.
Temperature °C
| Month | ⌀ 1940 - 1950 | ⌀ 2013 - 2023 | +/- |
|---|---|---|---|
| Jan | -5.48 | -2.14 | 3.34 |
| Feb | -4.07 | -2.65 | 1.43 |
| Mar | -2.14 | 1.62 | 3.76 |
| Apr | 4.03 | 5.15 | 1.12 |
| May | 9.18 | 10.58 | 1.40 |
| Jun | 15.37 | 18.52 | 3.16 |
| Jul | 19.87 | 21.77 | 1.90 |
| Aug | 19.59 | 20.75 | 1.16 |
| Sep | 14.28 | 16.91 | 2.63 |
| Oct | 7.97 | 8.28 | 0.31 |
| Nov | 0.14 | 2.51 | 2.37 |
| Dec | -2.62 | -1.99 | 0.63 |
| ⌀ Month | 6.34 | 8.28 | 1.93 |
Sunshine (h)
| Month | ⌀ 1940 - 1950 | ⌀ 2013 - 2023 | +/- |
|---|---|---|---|
| Jan | 7.76 | 7.37 | -0.40 |
| Feb | 8.83 | 8.43 | -0.40 |
| Mar | 9.67 | 9.41 | -0.26 |
| Apr | 10.19 | 10.14 | -0.05 |
| May | 11.04 | 10.64 | -0.40 |
| Jun | 12.24 | 12.86 | 0.62 |
| Jul | 12.94 | 12.71 | -0.23 |
| Aug | 11.66 | 11.84 | 0.18 |
| Sep | 10.37 | 10.38 | 0.00 |
| Oct | 9.06 | 8.81 | -0.25 |
| Nov | 7.90 | 7.85 | -0.05 |
| Dec | 7.33 | 7.06 | -0.27 |
| ⌀ Month | 9.92 | 9.79 | -0.13 |
Rain (mm)
| Month | ⌀ 1940 - 1950 | ⌀ 2013 - 2023 | +/- |
|---|---|---|---|
| Jan | 0.02 | 0.02 | -0.00 |
| Feb | 0.04 | 0.03 | -0.01 |
| Mar | 0.20 | 0.26 | 0.05 |
| Apr | 1.26 | 0.87 | -0.40 |
| May | 2.27 | 2.47 | 0.20 |
| Jun | 2.53 | 1.32 | -1.21 |
| Jul | 1.55 | 1.36 | -0.19 |
| Aug | 1.24 | 0.90 | -0.34 |
| Sep | 1.37 | 1.22 | -0.15 |
| Oct | 0.83 | 0.49 | -0.34 |
| Nov | 0.10 | 0.13 | 0.02 |
| Dec | 0.02 | 0.02 | 0.00 |
| ⌀ Month | 0.95 | 0.76 | -0.20 |
Snow (mm)
| Month | ⌀ 1940 - 1950 | ⌀ 2013 - 2023 | +/- |
|---|---|---|---|
| Jan | 0.34 | 0.40 | 0.06 |
| Feb | 0.32 | 0.49 | 0.18 |
| Mar | 0.67 | 0.82 | 0.14 |
| Apr | 1.01 | 0.84 | -0.17 |
| May | 0.44 | 0.48 | 0.04 |
| Jun | 0.06 | 0.01 | -0.06 |
| Jul | 0.00 | 0.00 | 0.00 |
| Aug | 0.00 | 0.00 | 0.00 |
| Sep | 0.08 | 0.04 | -0.05 |
| Oct | 0.19 | 0.32 | 0.14 |
| Nov | 0.38 | 0.44 | 0.07 |
| Dec | 0.26 | 0.44 | 0.18 |
| ⌀ Month | 0.31 | 0.36 | 0.04 |