Climate Chart of Charlotte Amalie, Virgin Islands (U.S.)
Comprehensive Climate Chart of Charlotte Amalie, Virgin Islands (U.S.): Monthly Averages and Weather Trends
Discover the climate of Charlotte Amalie, Virgin Islands (U.S.), a tropical paradise with year-round warmth and stunning weather.
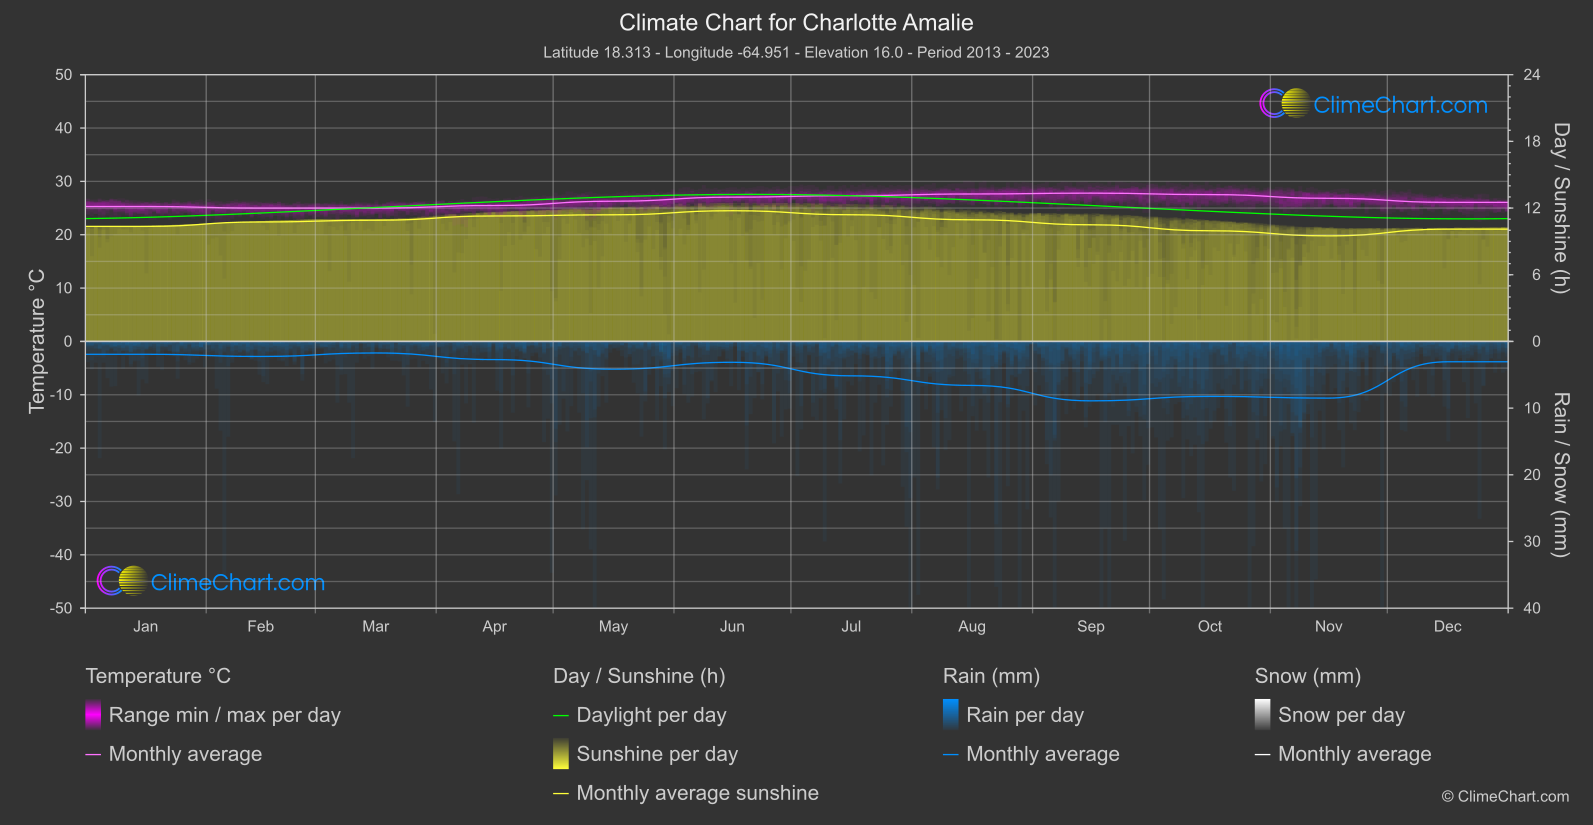
Charlotte Amalie in the U.S. Virgin Islands enjoys a tropical savanna climate with consistently warm temperatures throughout the year. The average temperature ranges from 77°F to 88°F (25°C to 31°C), making it a perfect destination for sun-seekers. The region experiences a wet season from May to October, with the highest rainfall occurring in September. The dry season runs from December to April, offering sunny days and lower humidity levels.
Best Travel Time Guide for Charlotte Amalie, Virgin Islands (U.S.): Ideal Seasons and Weather Insights
The best time to travel to Charlotte Amalie, Virgin Islands (U.S.), is during the dry season from December to April when you can enjoy sunny days and lower humidity levels. This period offers ideal conditions for beach activities, water sports, and exploring the island's natural beauty.
Climate Data Overview for Charlotte Amalie, Virgin Islands (U.S.)
Explore the comprehensive climate data for Charlotte Amalie, Virgin Islands (U.S.). This detailed table provides valuable insights into temperature variations, precipitation levels, and seasonal changes, helping you understand the unique weather patterns of this region.
| Month | ⌀ Temperature °C | ⌀ Rain (mm) | ⌀ Snow (mm) | ⌀ Sunshine (h) |
|---|---|---|---|---|
| Jan | 25.3 | 0.96 | 0.00 | 10.35 |
| Feb | 25.0 | 1.13 | 0.00 | 10.75 |
| Mar | 25.0 | 0.87 | 0.00 | 10.91 |
| Apr | 25.5 | 1.36 | 0.00 | 11.29 |
| May | 26.3 | 2.08 | 0.00 | 11.39 |
| Jun | 27.0 | 1.56 | 0.00 | 11.76 |
| Jul | 27.3 | 2.58 | 0.00 | 11.40 |
| Aug | 27.6 | 3.30 | 0.00 | 10.94 |
| Sep | 27.8 | 4.46 | 0.00 | 10.49 |
| Oct | 27.5 | 4.12 | 0.00 | 9.96 |
| Nov | 26.8 | 4.25 | 0.00 | 9.50 |
| Dec | 26.1 | 1.52 | 0.00 | 10.10 |
| ⌀ Month | 26.4 | 2.35 | 0.00 | 10.74 |