Climate Change Chart of Charlotte Amalie, Virgin Islands (U.S.)
Comprehensive Climate Change Chart of Charlotte Amalie, Virgin Islands (U.S.): Monthly Averages and Impact Trends
Exploring the climate changes in Charlotte Amalie, Virgin Islands (U.S.) reveals interesting insights into temperature, rainfall, and sunshine duration trends over the years.
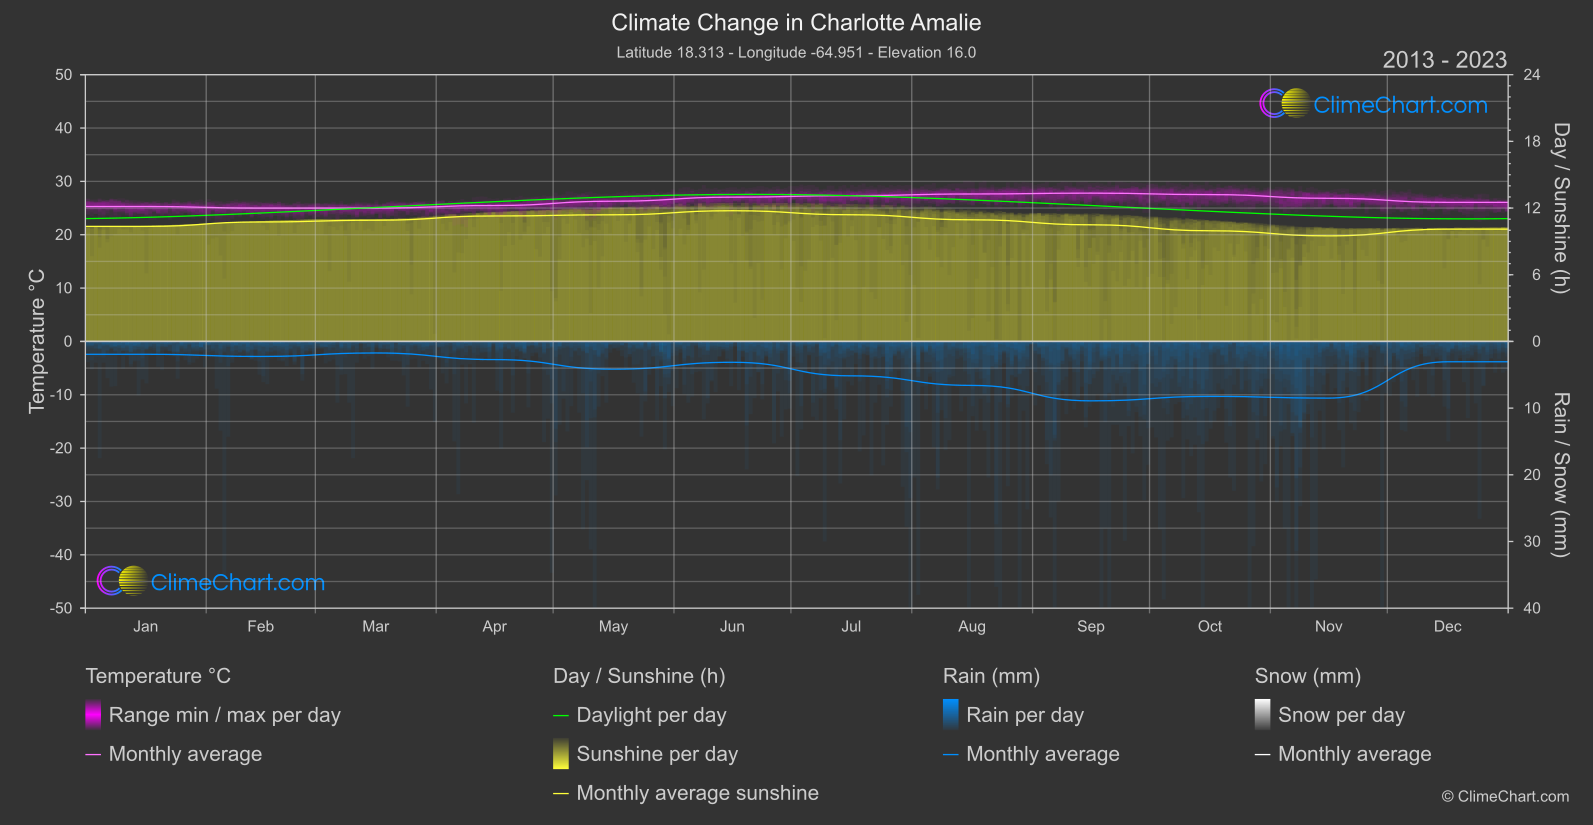
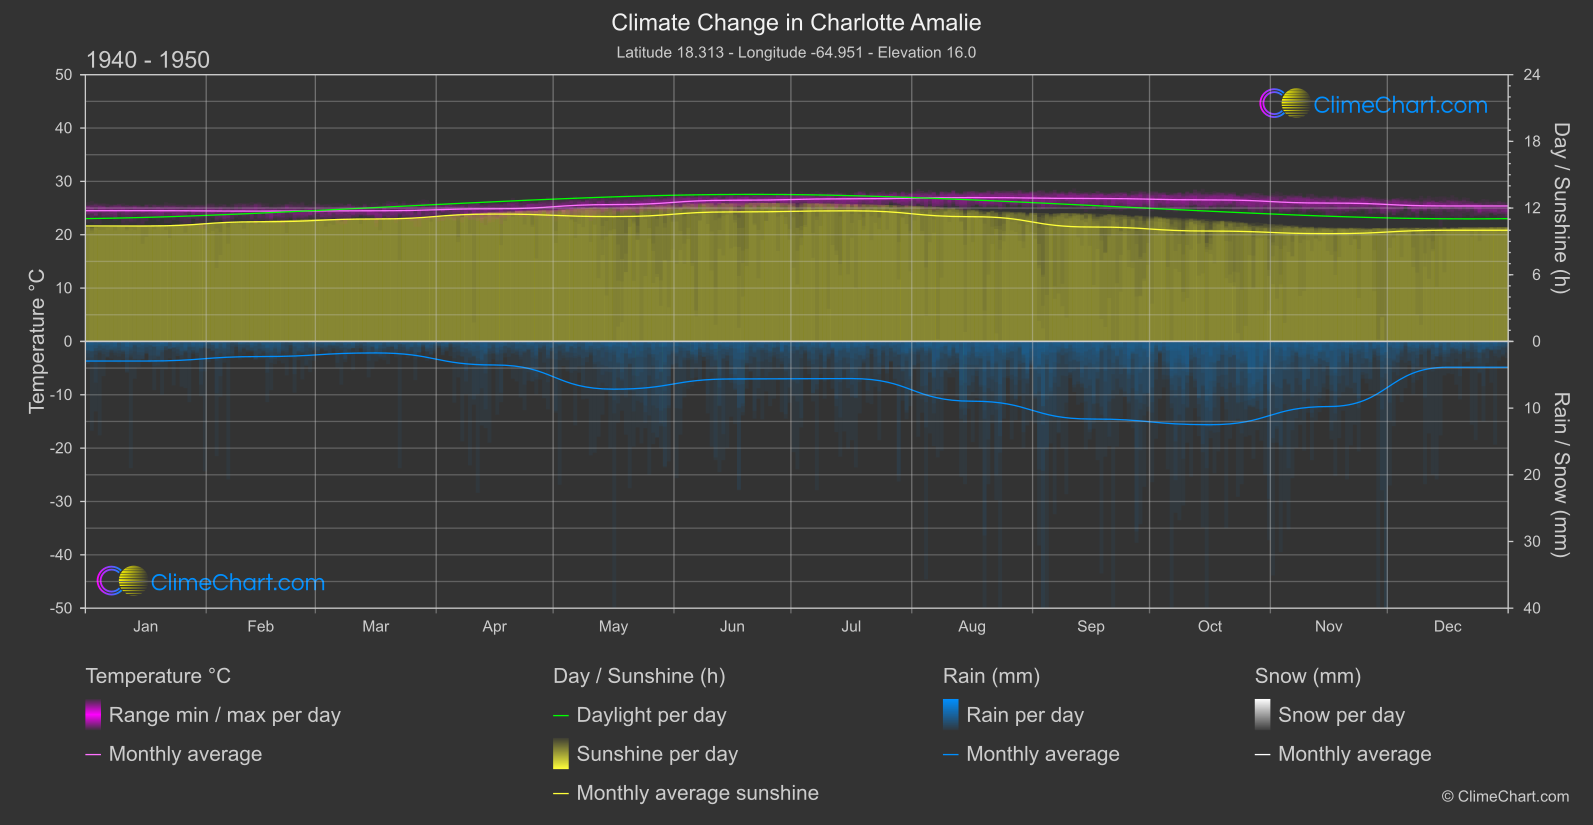
Charlotte Amalie, located in the Virgin Islands (U.S.), has experienced notable changes in temperature, rainfall, and sunshine duration over the years. Analyzing the data from the 1940s to the 1950s compared to the period from 2013 to 2024, we observe varying trends across different months. For temperature, September stands out with a significant increase of 1.002°C, while May has seen a notable rise in rainfall with a decrease of 1.499 mm. Additionally, June shows a decrease in sunshine duration by 1.251 hours. These insights shed light on the shifting climate patterns in Charlotte Amalie.
Climate Change Data Overview for Charlotte Amalie, Virgin Islands (U.S.)
Explore the comprehensive climate change data for Charlotte Amalie, Virgin Islands (U.S.). This detailed table provides valuable insights into temperature variations, precipitation levels, and seasonal changes influenced by climate change, helping you understand the unique weather patterns of this region.
Temperature °C
| Month | ⌀ 1940 - 1950 | ⌀ 2013 - 2023 | +/- |
|---|---|---|---|
| Jan | 24.51 | 25.29 | 0.78 |
| Feb | 24.43 | 24.99 | 0.56 |
| Mar | 24.49 | 25.00 | 0.51 |
| Apr | 24.86 | 25.48 | 0.62 |
| May | 25.65 | 26.28 | 0.63 |
| Jun | 26.47 | 27.04 | 0.58 |
| Jul | 26.74 | 27.33 | 0.59 |
| Aug | 26.96 | 27.64 | 0.67 |
| Sep | 26.79 | 27.80 | 1.00 |
| Oct | 26.53 | 27.52 | 0.99 |
| Nov | 25.93 | 26.83 | 0.90 |
| Dec | 25.39 | 26.07 | 0.67 |
| ⌀ Month | 25.73 | 26.44 | 0.71 |
Sunshine (h)
| Month | ⌀ 1940 - 1950 | ⌀ 2013 - 2023 | +/- |
|---|---|---|---|
| Jan | 10.39 | 10.35 | -0.04 |
| Feb | 10.77 | 10.75 | -0.02 |
| Mar | 11.02 | 10.91 | -0.11 |
| Apr | 11.46 | 11.29 | -0.17 |
| May | 11.23 | 11.39 | 0.16 |
| Jun | 11.65 | 11.76 | 0.11 |
| Jul | 11.75 | 11.40 | -0.35 |
| Aug | 11.22 | 10.94 | -0.28 |
| Sep | 10.30 | 10.49 | 0.20 |
| Oct | 9.93 | 9.96 | 0.03 |
| Nov | 9.70 | 9.50 | -0.20 |
| Dec | 10.00 | 10.10 | 0.10 |
| ⌀ Month | 10.78 | 10.74 | -0.05 |
Rain (mm)
| Month | ⌀ 1940 - 1950 | ⌀ 2013 - 2023 | +/- |
|---|---|---|---|
| Jan | 1.47 | 0.96 | -0.51 |
| Feb | 1.13 | 1.13 | -0.01 |
| Mar | 0.86 | 0.87 | 0.00 |
| Apr | 1.77 | 1.36 | -0.41 |
| May | 3.58 | 2.08 | -1.50 |
| Jun | 2.81 | 1.56 | -1.25 |
| Jul | 2.79 | 2.58 | -0.21 |
| Aug | 4.48 | 3.30 | -1.18 |
| Sep | 5.82 | 4.46 | -1.36 |
| Oct | 6.24 | 4.12 | -2.12 |
| Nov | 4.88 | 4.25 | -0.63 |
| Dec | 1.93 | 1.52 | -0.41 |
| ⌀ Month | 3.15 | 2.35 | -0.80 |
Snow (mm)
| Month | ⌀ 1940 - 1950 | ⌀ 2013 - 2023 | +/- |
|---|---|---|---|
| Jan | 0.00 | 0.00 | 0.00 |
| Feb | 0.00 | 0.00 | 0.00 |
| Mar | 0.00 | 0.00 | 0.00 |
| Apr | 0.00 | 0.00 | 0.00 |
| May | 0.00 | 0.00 | 0.00 |
| Jun | 0.00 | 0.00 | 0.00 |
| Jul | 0.00 | 0.00 | 0.00 |
| Aug | 0.00 | 0.00 | 0.00 |
| Sep | 0.00 | 0.00 | 0.00 |
| Oct | 0.00 | 0.00 | 0.00 |
| Nov | 0.00 | 0.00 | 0.00 |
| Dec | 0.00 | 0.00 | 0.00 |
| ⌀ Month | 0.00 | 0.00 | 0.00 |