Climate Chart of Capri, Italy
Comprehensive Climate Chart of Capri, Italy: Monthly Averages and Weather Trends
Discover the enchanting island of Capri, Italy
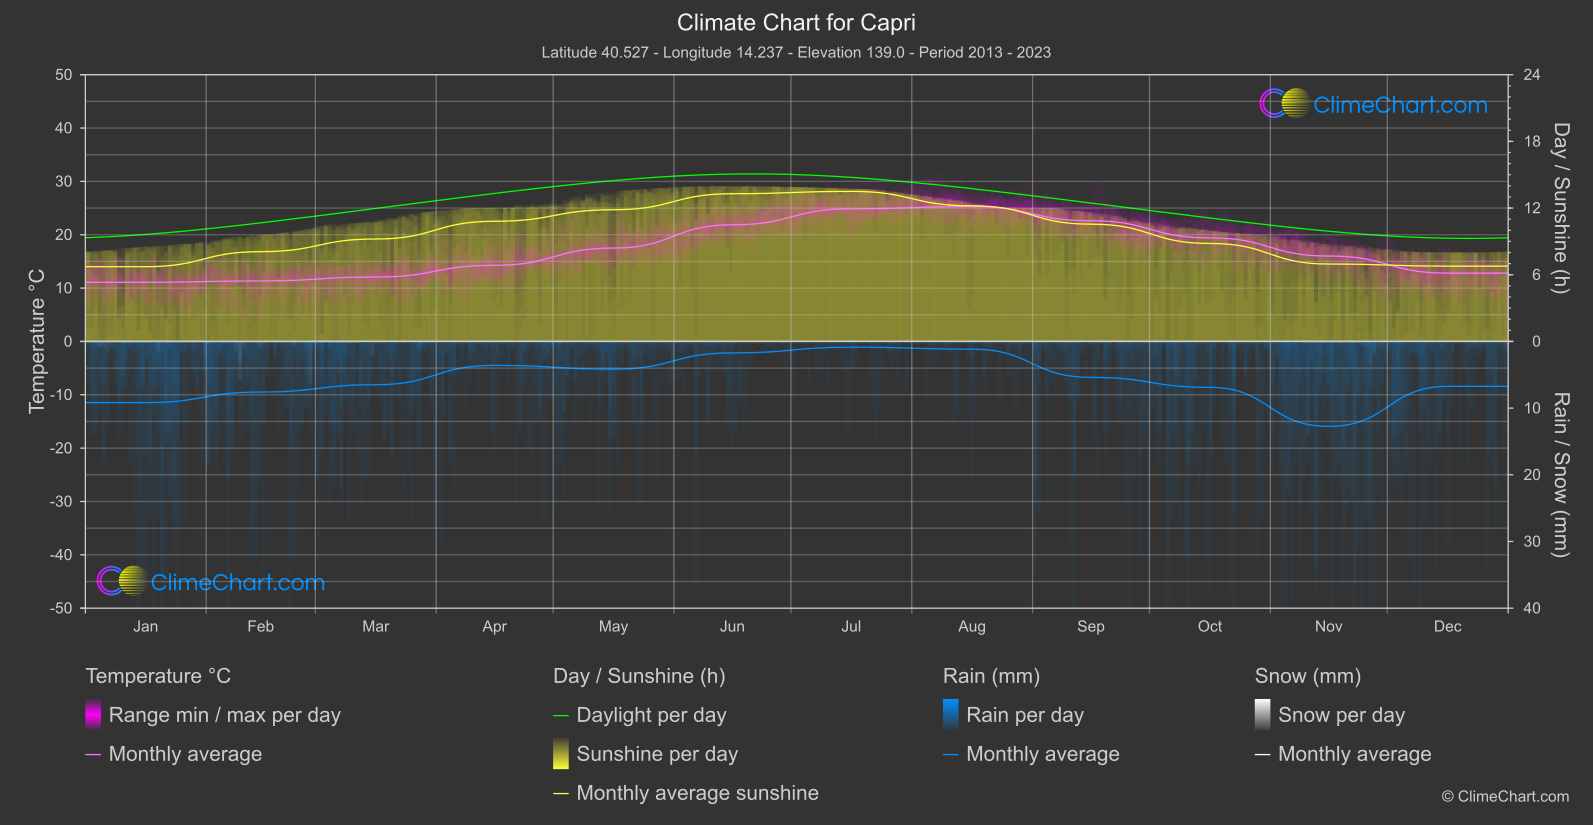
Capri, Italy boasts a Mediterranean climate with warm, dry summers and mild, wet winters. The average temperature ranges from 10°C in winter to 27°C in summer. The island experiences most of its rainfall in the winter months, while summers are generally sunny and warm. Capri is a popular destination year-round, offering visitors stunning landscapes and a rich cultural heritage.
Best Travel Time Guide for Capri, Italy: Ideal Seasons and Weather Insights
The best time to visit Capri is during the spring and early summer months, from April to June, when the weather is pleasant and the island is in full bloom. September and October also offer great weather for exploring the island without the peak summer crowds. Avoid the winter months if you prefer warmer temperatures and more outdoor activities.
Climate Data Overview for Capri, Italy
Explore the comprehensive climate data for Capri, Italy. This detailed table provides valuable insights into temperature variations, precipitation levels, and seasonal changes, helping you understand the unique weather patterns of this region.
| Month | ⌀ Temperature °C | ⌀ Rain (mm) | ⌀ Snow (mm) | ⌀ Sunshine (h) |
|---|---|---|---|---|
| Jan | 11.1 | 4.59 | 0.00 | 6.73 |
| Feb | 11.3 | 3.80 | 0.01 | 8.08 |
| Mar | 12.1 | 3.25 | 0.00 | 9.22 |
| Apr | 14.3 | 1.79 | 0.00 | 10.81 |
| May | 17.5 | 2.08 | 0.00 | 11.85 |
| Jun | 21.9 | 0.86 | 0.00 | 13.29 |
| Jul | 24.9 | 0.43 | 0.00 | 13.50 |
| Aug | 25.3 | 0.58 | 0.00 | 12.20 |
| Sep | 22.6 | 2.69 | 0.00 | 10.55 |
| Oct | 19.4 | 3.44 | 0.00 | 8.82 |
| Nov | 16.0 | 6.37 | 0.00 | 6.96 |
| Dec | 12.8 | 3.37 | 0.00 | 6.78 |
| ⌀ Month | 17.4 | 2.77 | 0.00 | 9.90 |