Climate Change Chart of Capri, Italy
Comprehensive Climate Change Chart of Capri, Italy: Monthly Averages and Impact Trends
Explore the changing climate of Capri, Italy, through insightful data analysis. Discover how temperatures, rainfall, snowfall, and sunshine duration have evolved over the years.
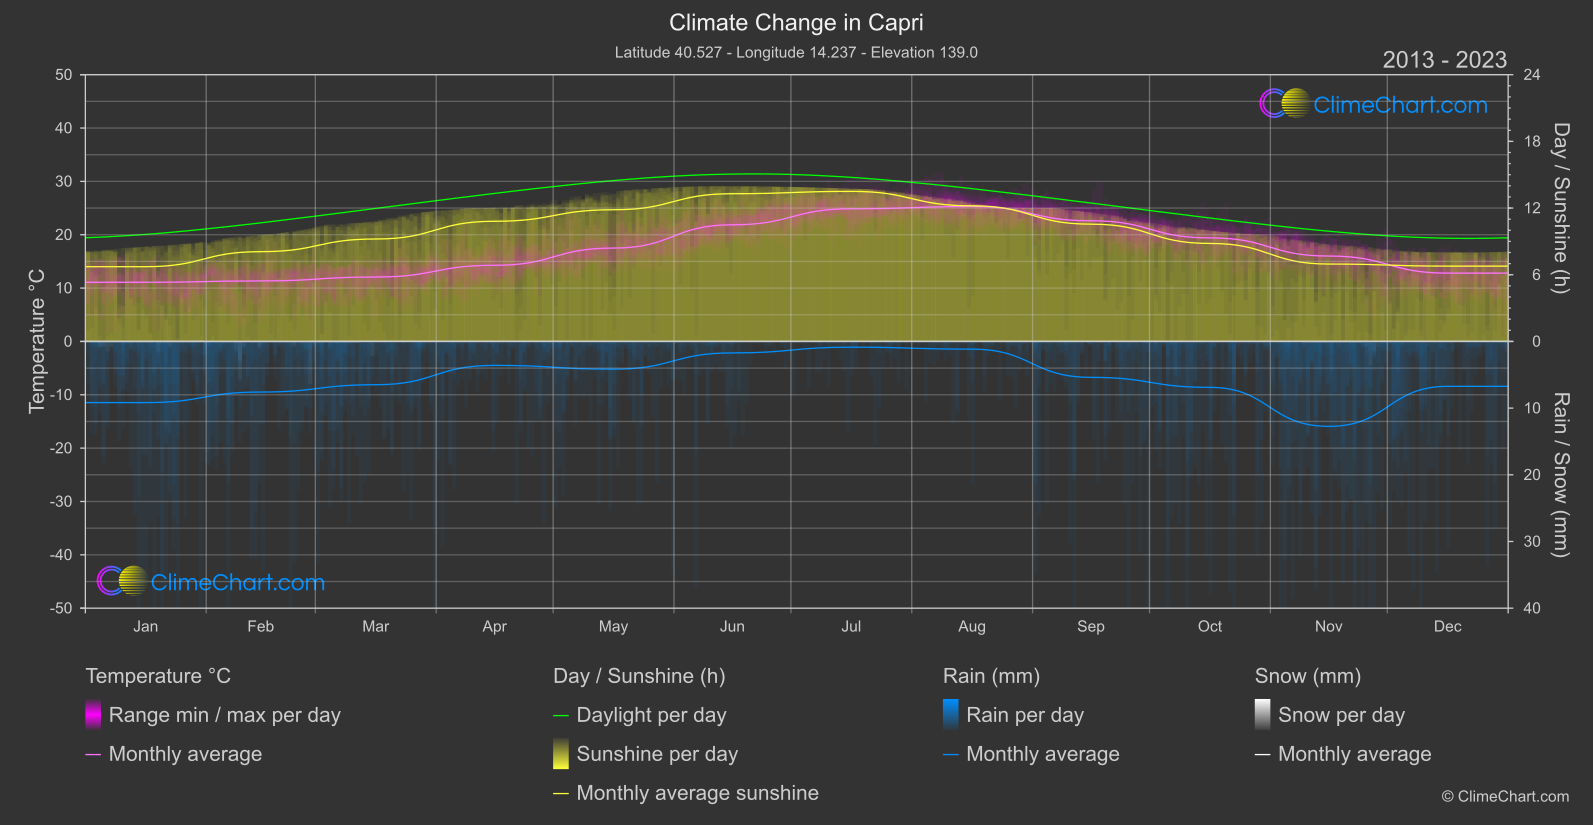
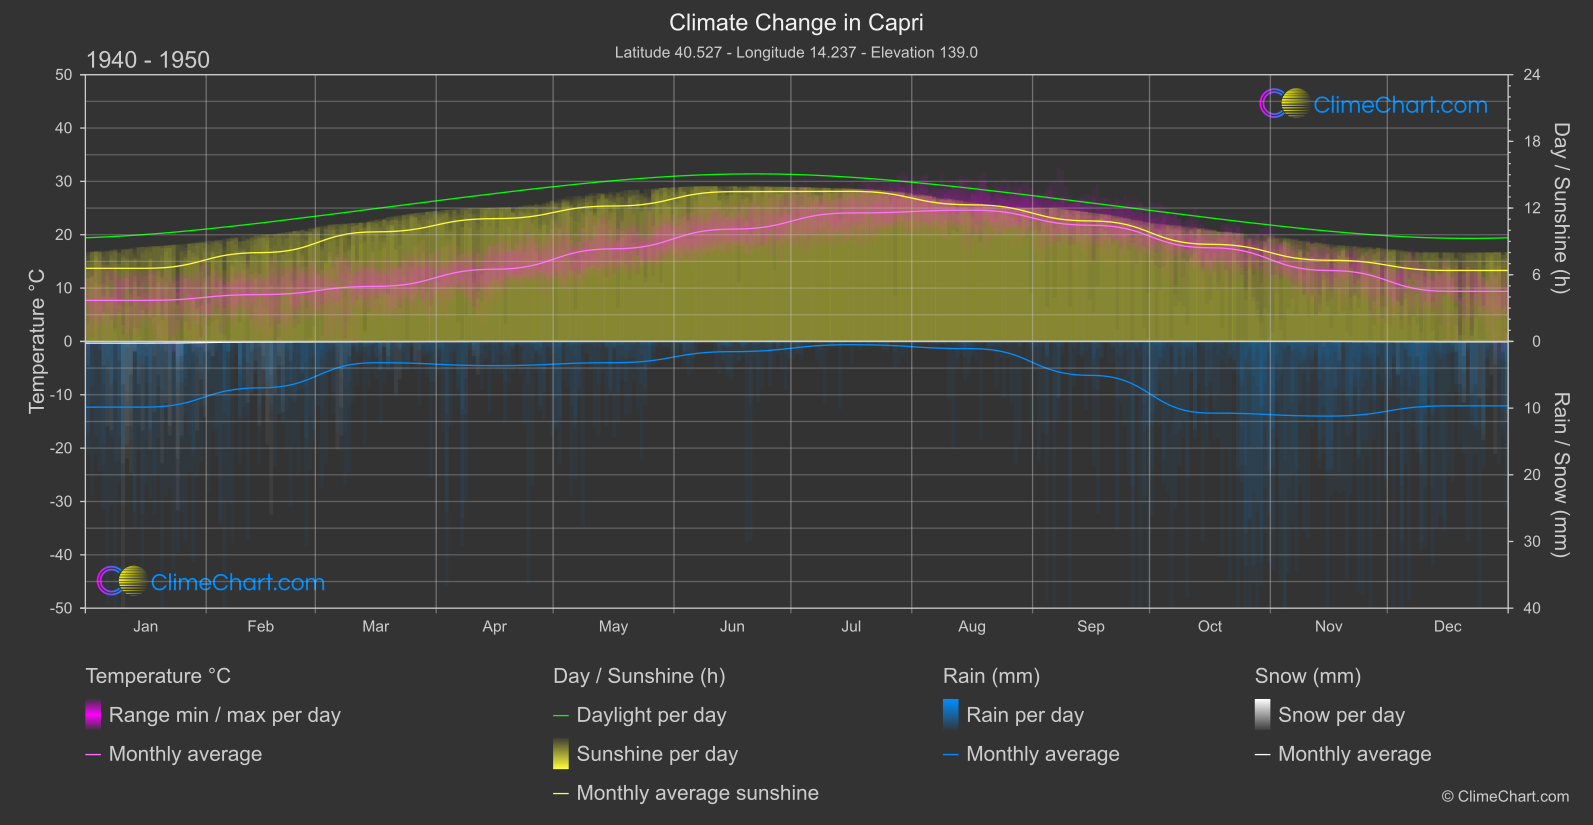
Capri, Italy, has experienced significant changes in its climate over the years. From 1940 to 1950 compared to 2013 to 2024, the data shows a noticeable increase in temperatures across most months, with January and December exhibiting the highest temperature changes. Rainfall patterns have also shifted, with notable changes in March and October. Snowfall has decreased significantly in most months, particularly from January to September. Additionally, the sunshine duration has shown varying trends throughout the year, with December experiencing the most significant increase in sunshine hours.
Climate Change Data Overview for Capri, Italy
Explore the comprehensive climate change data for Capri, Italy. This detailed table provides valuable insights into temperature variations, precipitation levels, and seasonal changes influenced by climate change, helping you understand the unique weather patterns of this region.
Temperature °C
| Month | ⌀ 1940 - 1950 | ⌀ 2013 - 2023 | +/- |
|---|---|---|---|
| Jan | 7.69 | 11.09 | 3.40 |
| Feb | 8.78 | 11.34 | 2.56 |
| Mar | 10.32 | 12.07 | 1.75 |
| Apr | 13.53 | 14.27 | 0.74 |
| May | 17.36 | 17.50 | 0.14 |
| Jun | 21.05 | 21.86 | 0.81 |
| Jul | 24.08 | 24.87 | 0.78 |
| Aug | 24.60 | 25.28 | 0.68 |
| Sep | 21.78 | 22.62 | 0.84 |
| Oct | 17.55 | 19.41 | 1.86 |
| Nov | 13.30 | 16.01 | 2.71 |
| Dec | 9.39 | 12.80 | 3.41 |
| ⌀ Month | 15.79 | 17.43 | 1.64 |
Sunshine (h)
| Month | ⌀ 1940 - 1950 | ⌀ 2013 - 2023 | +/- |
|---|---|---|---|
| Jan | 6.58 | 6.73 | 0.15 |
| Feb | 7.99 | 8.08 | 0.09 |
| Mar | 9.86 | 9.22 | -0.64 |
| Apr | 11.05 | 10.81 | -0.24 |
| May | 12.19 | 11.85 | -0.34 |
| Jun | 13.48 | 13.29 | -0.19 |
| Jul | 13.51 | 13.50 | -0.00 |
| Aug | 12.29 | 12.20 | -0.09 |
| Sep | 10.84 | 10.55 | -0.29 |
| Oct | 8.74 | 8.82 | 0.08 |
| Nov | 7.30 | 6.96 | -0.34 |
| Dec | 6.38 | 6.78 | 0.39 |
| ⌀ Month | 10.02 | 9.90 | -0.12 |
Rain (mm)
| Month | ⌀ 1940 - 1950 | ⌀ 2013 - 2023 | +/- |
|---|---|---|---|
| Jan | 4.93 | 4.59 | -0.34 |
| Feb | 3.48 | 3.80 | 0.32 |
| Mar | 1.59 | 3.25 | 1.65 |
| Apr | 1.81 | 1.79 | -0.02 |
| May | 1.59 | 2.08 | 0.48 |
| Jun | 0.76 | 0.86 | 0.10 |
| Jul | 0.25 | 0.43 | 0.19 |
| Aug | 0.54 | 0.58 | 0.04 |
| Sep | 2.55 | 2.69 | 0.15 |
| Oct | 5.37 | 3.44 | -1.93 |
| Nov | 5.60 | 6.37 | 0.77 |
| Dec | 4.83 | 3.37 | -1.46 |
| ⌀ Month | 2.78 | 2.77 | -0.01 |
Snow (mm)
| Month | ⌀ 1940 - 1950 | ⌀ 2013 - 2023 | +/- |
|---|---|---|---|
| Jan | 0.12 | 0.00 | -0.12 |
| Feb | 0.05 | 0.01 | -0.04 |
| Mar | 0.02 | 0.00 | -0.02 |
| Apr | 0.00 | 0.00 | -0.00 |
| May | 0.00 | 0.00 | 0.00 |
| Jun | 0.00 | 0.00 | 0.00 |
| Jul | 0.00 | 0.00 | 0.00 |
| Aug | 0.00 | 0.00 | 0.00 |
| Sep | 0.00 | 0.00 | 0.00 |
| Oct | 0.00 | 0.00 | 0.00 |
| Nov | 0.00 | 0.00 | 0.00 |
| Dec | 0.03 | 0.00 | -0.03 |
| ⌀ Month | 0.02 | 0.00 | -0.02 |