Climate Chart of Beirut, Lebanon
Comprehensive Climate Chart of Beirut, Lebanon: Monthly Averages and Weather Trends
Explore the Climate of Beirut, Lebanon
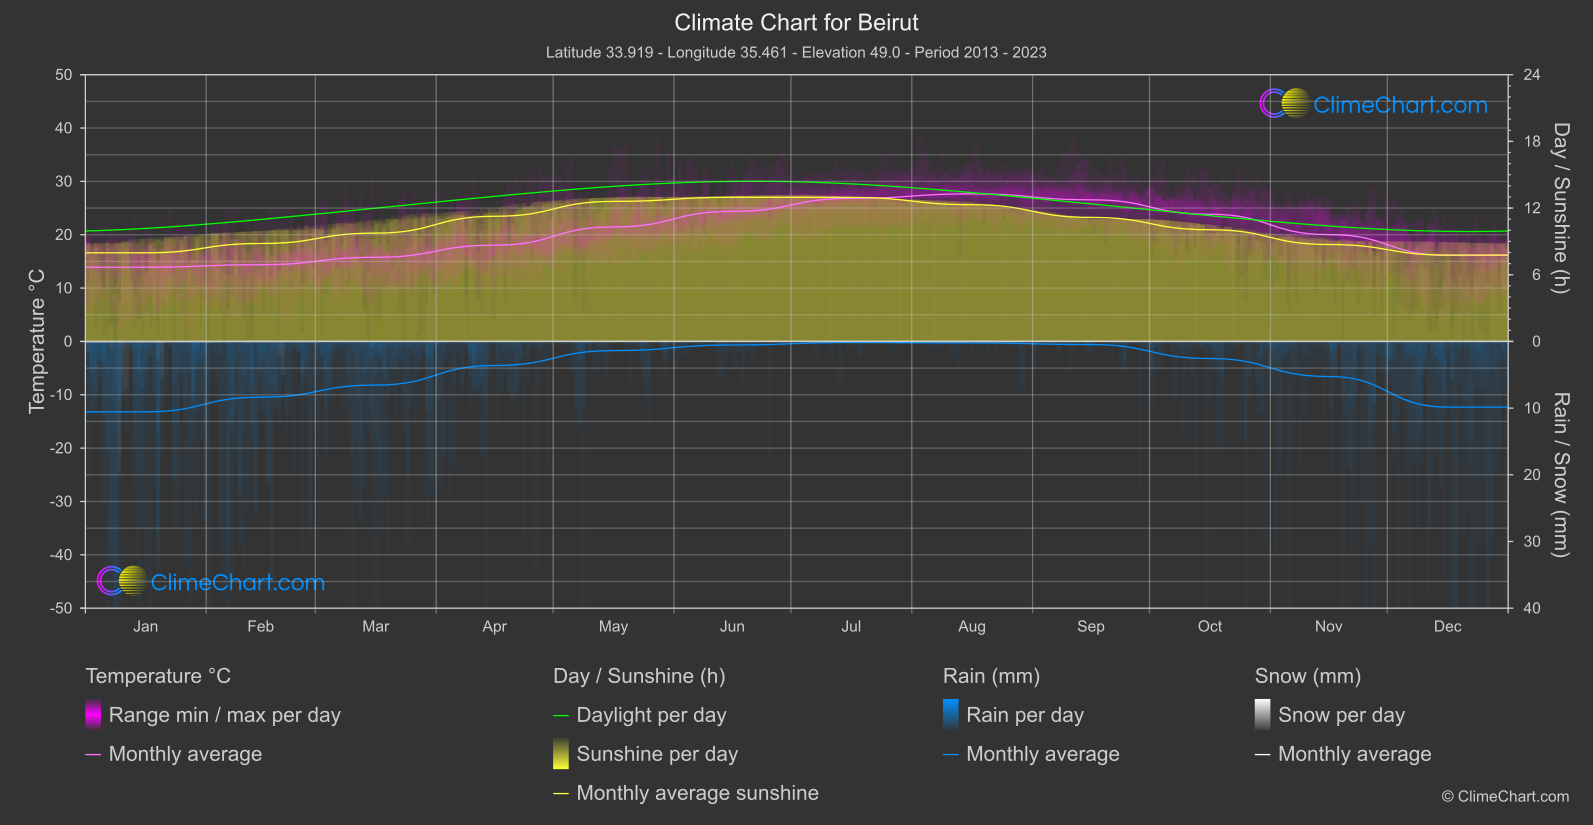
Beirut, the capital of Lebanon, enjoys a Mediterranean climate characterized by hot, dry summers and mild, rainy winters. The city experiences an average of 300 sunny days per year, making it a popular destination for tourists seeking warm weather and cultural experiences. During the summer months, temperatures can soar above 30°C (86°F), while winter temperatures rarely drop below 10°C (50°F). Beirut also experiences occasional rainfall from November to March, providing relief from the summer heat and contributing to the lush greenery of the city.
Best Travel Time Guide for Beirut, Lebanon: Ideal Seasons and Weather Insights
The best time to travel to Beirut is during the spring and fall months when the weather is pleasantly warm and ideal for exploring the city's attractions. Summer can be hot and crowded with tourists, while winter may bring occasional rainfall. Plan your trip to Beirut between April and May or September and November for the most enjoyable weather and cultural experiences.
Climate Data Overview for Beirut, Lebanon
Explore the comprehensive climate data for Beirut, Lebanon. This detailed table provides valuable insights into temperature variations, precipitation levels, and seasonal changes, helping you understand the unique weather patterns of this region.
| Month | ⌀ Temperature °C | ⌀ Rain (mm) | ⌀ Snow (mm) | ⌀ Sunshine (h) |
|---|---|---|---|---|
| Jan | 13.9 | 5.28 | 0.01 | 7.97 |
| Feb | 14.4 | 4.18 | 0.00 | 8.81 |
| Mar | 15.8 | 3.27 | 0.00 | 9.75 |
| Apr | 18.0 | 1.81 | 0.00 | 11.26 |
| May | 21.5 | 0.69 | 0.00 | 12.60 |
| Jun | 24.4 | 0.26 | 0.00 | 12.97 |
| Jul | 26.8 | 0.08 | 0.00 | 12.96 |
| Aug | 27.7 | 0.11 | 0.00 | 12.30 |
| Sep | 26.5 | 0.23 | 0.00 | 11.16 |
| Oct | 23.8 | 1.28 | 0.00 | 10.05 |
| Nov | 20.0 | 2.63 | 0.00 | 8.72 |
| Dec | 16.1 | 4.92 | 0.00 | 7.77 |
| ⌀ Month | 20.7 | 2.06 | 0.00 | 10.53 |