Climate Change Chart of Beirut, Lebanon
Comprehensive Climate Change Chart of Beirut, Lebanon: Monthly Averages and Impact Trends
Discover the changing climate in Beirut, Lebanon, through insightful data analysis. Explore the shifts in temperature, rainfall, snowfall, and sunshine duration from 1940 to 1950 compared to 2013 to 2024.
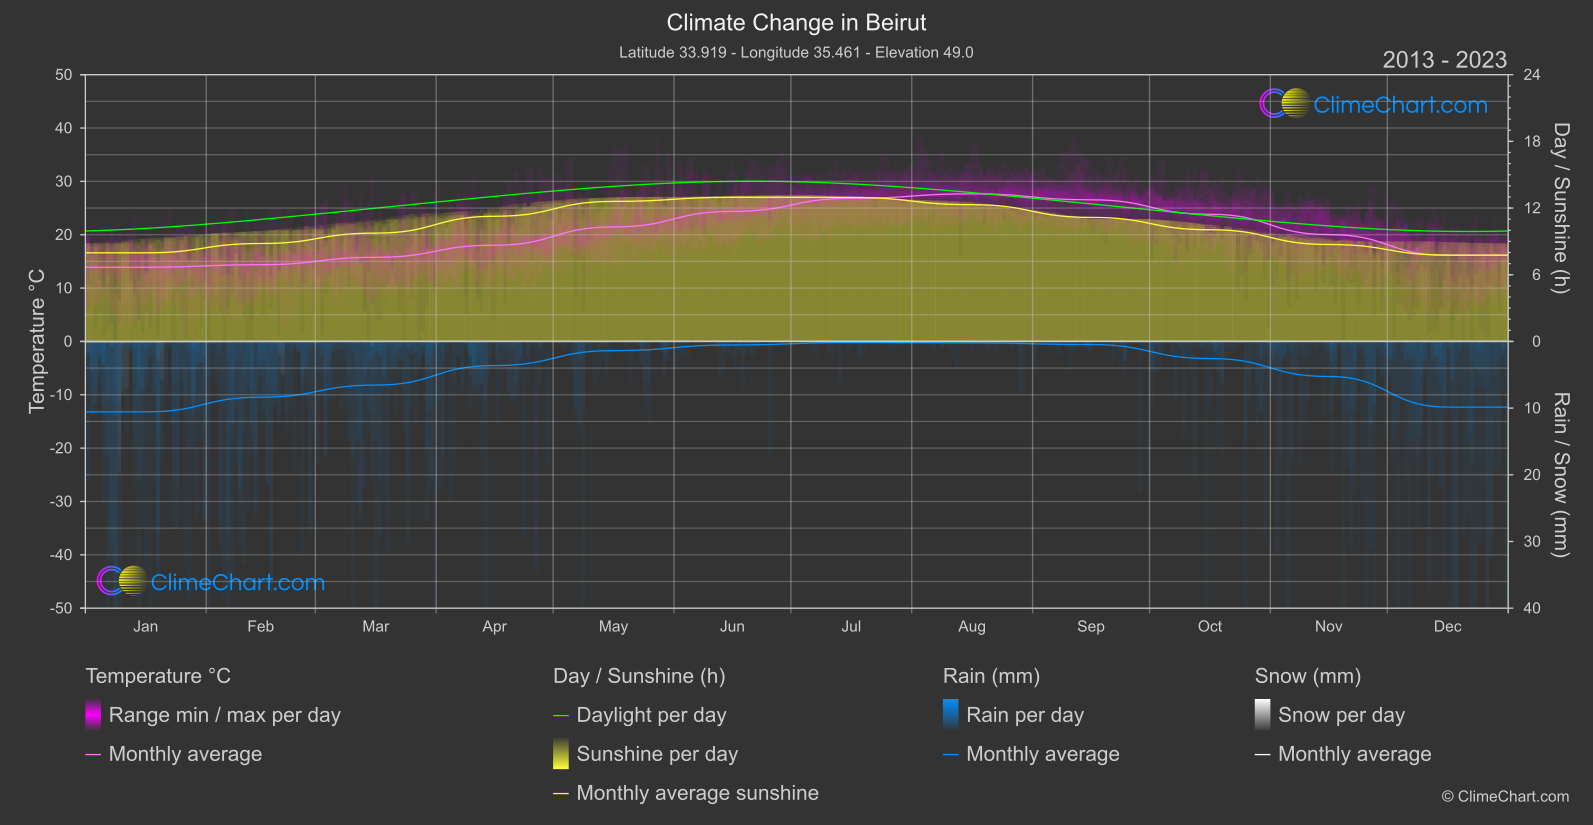
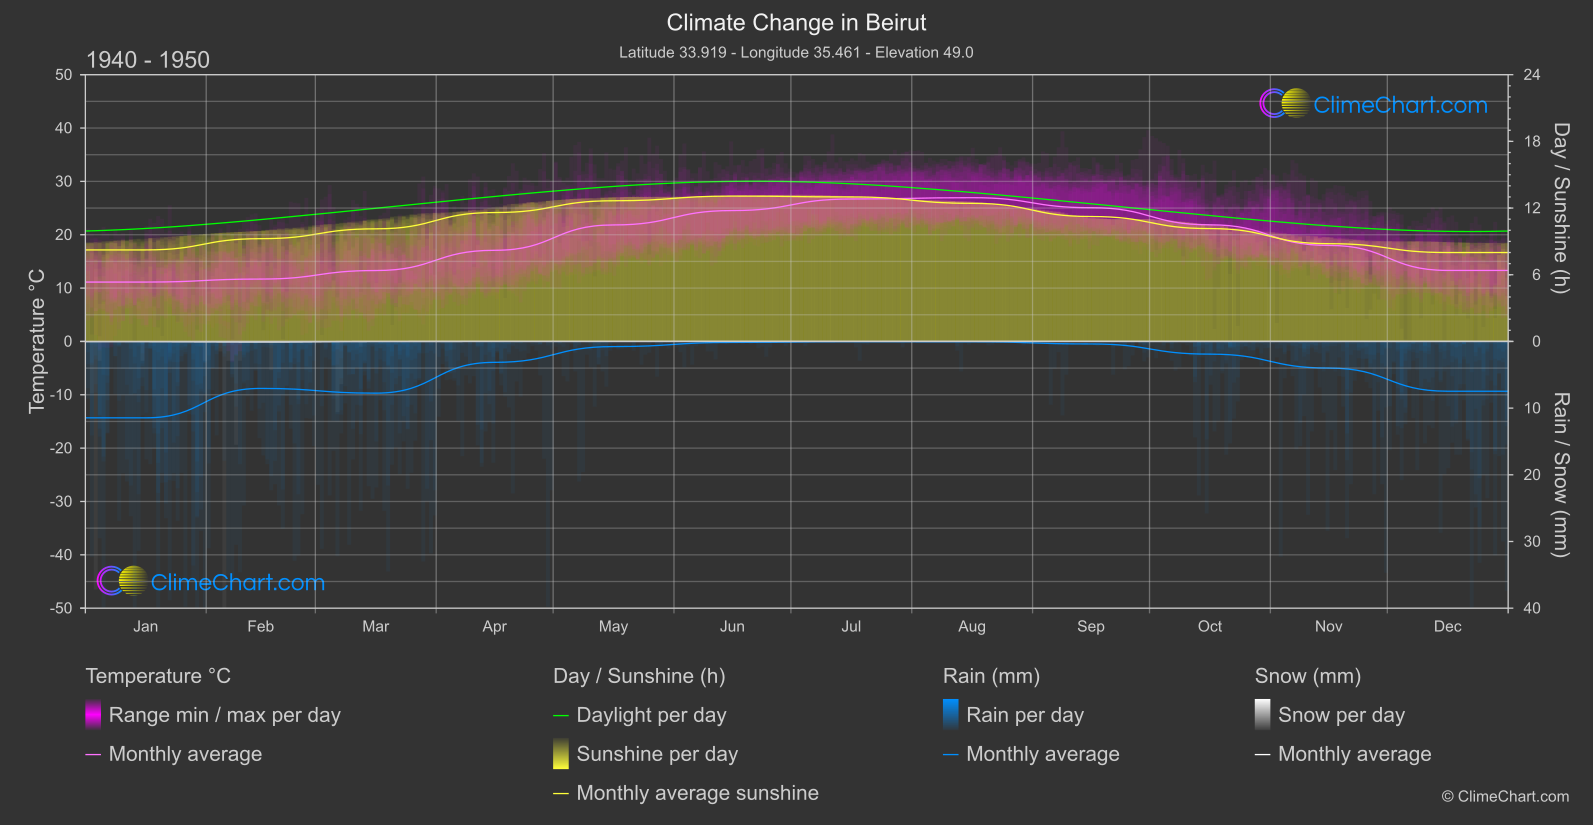
Beirut, the capital city of Lebanon, has experienced significant climate variations over the years. The data from 1940 to 1950 compared to 2013 to 2024 shows interesting trends. For instance, the month of December saw a notable increase in temperature, with a change of 2.82°C, indicating a warming trend. Conversely, May experienced a decrease in temperature by 0.37°C. In terms of rainfall, December witnessed a substantial rise of 1.19 mm. Moreover, the sunshine duration in Beirut showed a declining pattern, with December having a reduction of 0.23 hours.
Climate Change Data Overview for Beirut, Lebanon
Explore the comprehensive climate change data for Beirut, Lebanon. This detailed table provides valuable insights into temperature variations, precipitation levels, and seasonal changes influenced by climate change, helping you understand the unique weather patterns of this region.
Temperature °C
| Month | ⌀ 1940 - 1950 | ⌀ 2013 - 2023 | +/- |
|---|---|---|---|
| Jan | 11.13 | 13.91 | 2.78 |
| Feb | 11.69 | 14.38 | 2.69 |
| Mar | 13.29 | 15.77 | 2.48 |
| Apr | 17.08 | 18.04 | 0.96 |
| May | 21.84 | 21.46 | -0.37 |
| Jun | 24.53 | 24.38 | -0.15 |
| Jul | 26.70 | 26.82 | 0.12 |
| Aug | 26.95 | 27.66 | 0.72 |
| Sep | 25.07 | 26.55 | 1.48 |
| Oct | 21.86 | 23.83 | 1.98 |
| Nov | 18.00 | 20.03 | 2.03 |
| Dec | 13.31 | 16.13 | 2.82 |
| ⌀ Month | 19.29 | 20.75 | 1.46 |
Sunshine (h)
| Month | ⌀ 1940 - 1950 | ⌀ 2013 - 2023 | +/- |
|---|---|---|---|
| Jan | 8.23 | 7.97 | -0.26 |
| Feb | 9.25 | 8.81 | -0.44 |
| Mar | 10.13 | 9.75 | -0.38 |
| Apr | 11.60 | 11.26 | -0.34 |
| May | 12.66 | 12.60 | -0.06 |
| Jun | 13.08 | 12.97 | -0.10 |
| Jul | 13.00 | 12.96 | -0.04 |
| Aug | 12.42 | 12.30 | -0.12 |
| Sep | 11.24 | 11.16 | -0.08 |
| Oct | 10.15 | 10.05 | -0.11 |
| Nov | 8.79 | 8.72 | -0.07 |
| Dec | 8.00 | 7.77 | -0.23 |
| ⌀ Month | 10.71 | 10.53 | -0.19 |
Rain (mm)
| Month | ⌀ 1940 - 1950 | ⌀ 2013 - 2023 | +/- |
|---|---|---|---|
| Jan | 5.73 | 5.28 | -0.45 |
| Feb | 3.52 | 4.18 | 0.66 |
| Mar | 3.88 | 3.27 | -0.61 |
| Apr | 1.57 | 1.81 | 0.24 |
| May | 0.39 | 0.69 | 0.30 |
| Jun | 0.07 | 0.26 | 0.19 |
| Jul | 0.02 | 0.08 | 0.06 |
| Aug | 0.02 | 0.11 | 0.09 |
| Sep | 0.19 | 0.23 | 0.04 |
| Oct | 0.95 | 1.28 | 0.33 |
| Nov | 2.00 | 2.63 | 0.63 |
| Dec | 3.73 | 4.92 | 1.19 |
| ⌀ Month | 1.84 | 2.06 | 0.22 |
Snow (mm)
| Month | ⌀ 1940 - 1950 | ⌀ 2013 - 2023 | +/- |
|---|---|---|---|
| Jan | 0.02 | 0.01 | -0.00 |
| Feb | 0.04 | 0.00 | -0.04 |
| Mar | 0.01 | 0.00 | -0.00 |
| Apr | 0.00 | 0.00 | 0.00 |
| May | 0.00 | 0.00 | 0.00 |
| Jun | 0.00 | 0.00 | 0.00 |
| Jul | 0.00 | 0.00 | 0.00 |
| Aug | 0.00 | 0.00 | 0.00 |
| Sep | 0.00 | 0.00 | 0.00 |
| Oct | 0.00 | 0.00 | 0.00 |
| Nov | 0.00 | 0.00 | 0.00 |
| Dec | 0.00 | 0.00 | 0.00 |
| ⌀ Month | 0.01 | 0.00 | -0.00 |