Climate Chart of Banjul, Gambia
Comprehensive Climate Chart of Banjul, Gambia: Monthly Averages and Weather Trends
Explore the climate of Banjul, Gambia
Banjul, the capital of Gambia, enjoys a tropical climate with distinct wet and dry seasons. The average annual temperature is around 27°C (81°F). The hottest months are from March to November, with temperatures reaching up to 32°C (90°F). The rainy season typically spans from June to October, with August and September receiving the highest rainfall. The dry season, from November to May, offers cooler temperatures and less humidity.
Best Travel Time Guide for Banjul, Gambia: Ideal Seasons and Weather Insights
The best time to travel to Banjul is during the dry season, from November to May, when the weather is cooler and there is less rainfall. This period is ideal for exploring the city and enjoying outdoor activities. However, if you prefer warmer temperatures and vibrant green landscapes, visiting during the rainy season from June to October can offer a unique experience of the tropical climate.
Climate Data Overview for Banjul, Gambia
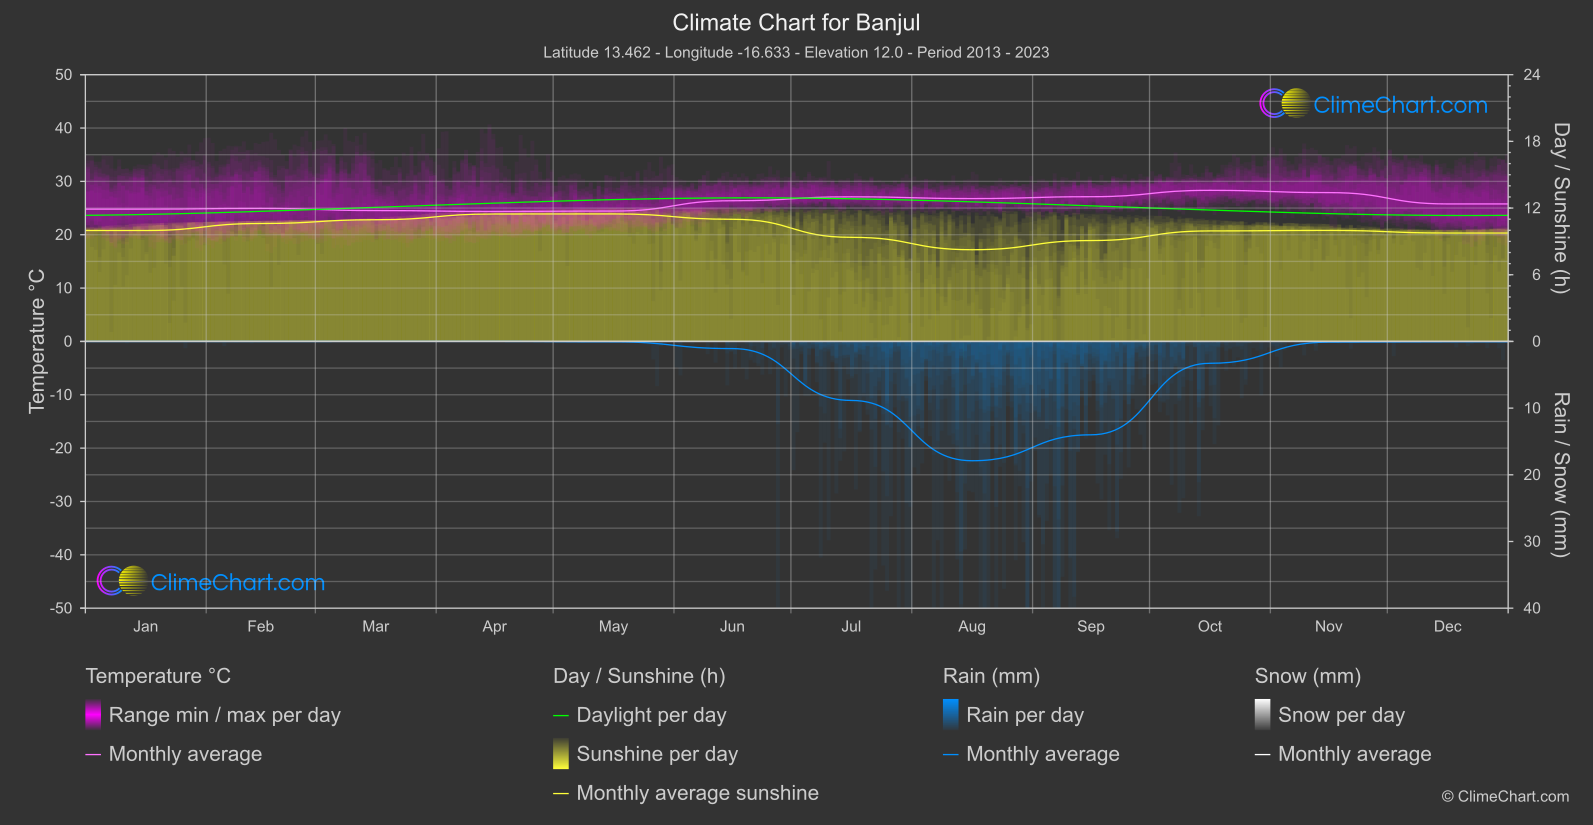
Explore the comprehensive climate data for Banjul, Gambia. This detailed table provides valuable insights into temperature variations, precipitation levels, and seasonal changes, helping you understand the unique weather patterns of this region.
| Month | ⌀ Temperature °C | ⌀ Rain (mm) | ⌀ Snow (mm) | ⌀ Sunshine (h) |
|---|---|---|---|---|
| Jan | 24.8 | 0.00 | 0.00 | 9.98 |
| Feb | 24.9 | 0.00 | 0.00 | 10.61 |
| Mar | 24.5 | 0.00 | 0.00 | 10.95 |
| Apr | 24.4 | 0.00 | 0.00 | 11.47 |
| May | 24.4 | 0.03 | 0.00 | 11.47 |
| Jun | 26.4 | 0.54 | 0.00 | 10.99 |
| Jul | 27.1 | 4.42 | 0.00 | 9.37 |
| Aug | 26.8 | 8.95 | 0.00 | 8.25 |
| Sep | 27.1 | 7.00 | 0.00 | 9.08 |
| Oct | 28.3 | 1.64 | 0.00 | 9.94 |
| Nov | 27.9 | 0.05 | 0.00 | 9.99 |
| Dec | 25.8 | 0.02 | 0.00 | 9.75 |
| ⌀ Month | 26.0 | 1.89 | 0.00 | 10.15 |