Climate Change Chart of Banjul, Gambia
Comprehensive Climate Change Chart of Banjul, Gambia: Monthly Averages and Impact Trends
Exploring the changing climate in Banjul, Gambia reveals significant shifts in temperature, rainfall, and sunshine duration over the years. Dive into the data to uncover insights about the impact of climate change on this region.
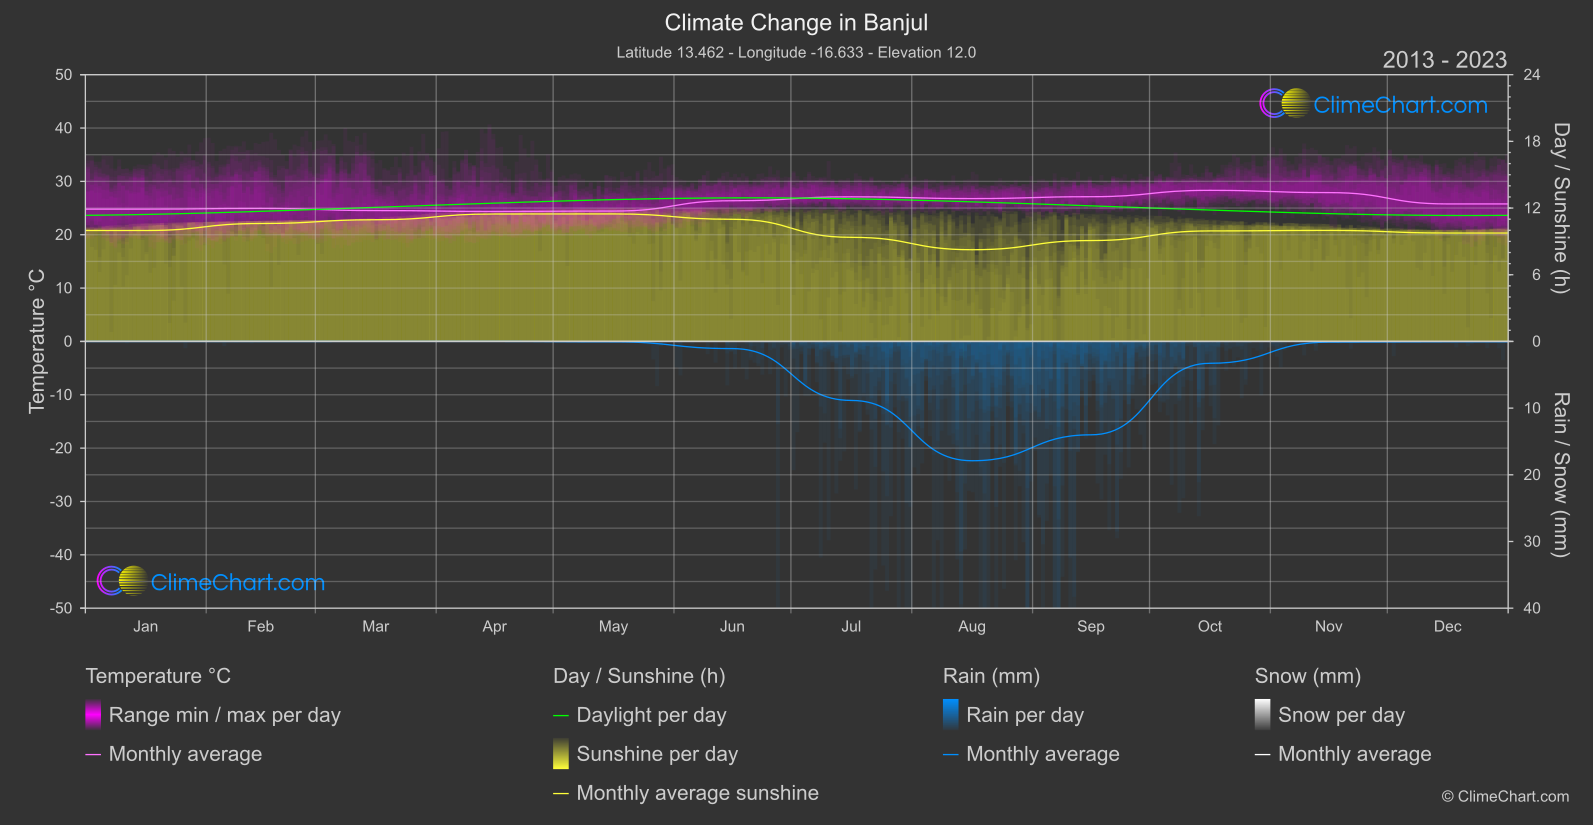

Banjul, the capital of Gambia, experiences varying climate patterns throughout the year. Analyzing the temperature data from 1940 to 1950 compared to 2013 to 2024 reveals interesting insights. The month of October shows the highest temperature change of 1.37°C, indicating a significant warming trend. In terms of rainfall, July exhibits the most notable change with almost 1mm decrease, suggesting a drier climate. Additionally, the sunshine duration in July decreased by approximately 0.78 hours, highlighting potential shifts in weather patterns and sunlight exposure.
Climate Change Data Overview for Banjul, Gambia
Explore the comprehensive climate change data for Banjul, Gambia. This detailed table provides valuable insights into temperature variations, precipitation levels, and seasonal changes influenced by climate change, helping you understand the unique weather patterns of this region.
Temperature °C
| Month | ⌀ 1940 - 1950 | ⌀ 2013 - 2023 | +/- |
|---|---|---|---|
| Jan | 23.75 | 24.80 | 1.05 |
| Feb | 24.36 | 24.93 | 0.57 |
| Mar | 24.90 | 24.53 | -0.37 |
| Apr | 24.72 | 24.36 | -0.36 |
| May | 24.97 | 24.44 | -0.53 |
| Jun | 26.38 | 26.37 | -0.01 |
| Jul | 26.57 | 27.11 | 0.54 |
| Aug | 25.89 | 26.78 | 0.89 |
| Sep | 26.14 | 27.13 | 0.99 |
| Oct | 26.95 | 28.32 | 1.37 |
| Nov | 26.55 | 27.90 | 1.35 |
| Dec | 24.70 | 25.77 | 1.07 |
| ⌀ Month | 25.49 | 26.04 | 0.55 |
Sunshine (h)
| Month | ⌀ 1940 - 1950 | ⌀ 2013 - 2023 | +/- |
|---|---|---|---|
| Jan | 10.15 | 9.98 | -0.17 |
| Feb | 10.69 | 10.61 | -0.08 |
| Mar | 11.12 | 10.95 | -0.17 |
| Apr | 11.67 | 11.47 | -0.20 |
| May | 11.88 | 11.47 | -0.40 |
| Jun | 11.30 | 10.99 | -0.31 |
| Jul | 10.14 | 9.37 | -0.78 |
| Aug | 8.96 | 8.25 | -0.71 |
| Sep | 9.25 | 9.08 | -0.17 |
| Oct | 10.12 | 9.94 | -0.18 |
| Nov | 10.14 | 9.99 | -0.15 |
| Dec | 9.80 | 9.75 | -0.04 |
| ⌀ Month | 10.43 | 10.15 | -0.28 |
Rain (mm)
| Month | ⌀ 1940 - 1950 | ⌀ 2013 - 2023 | +/- |
|---|---|---|---|
| Jan | 0.01 | 0.00 | -0.01 |
| Feb | 0.01 | 0.00 | -0.00 |
| Mar | 0.00 | 0.00 | 0.00 |
| Apr | 0.00 | 0.00 | -0.00 |
| May | 0.03 | 0.03 | 0.00 |
| Jun | 0.95 | 0.54 | -0.41 |
| Jul | 5.42 | 4.42 | -1.00 |
| Aug | 12.02 | 8.95 | -3.08 |
| Sep | 8.24 | 7.00 | -1.24 |
| Oct | 2.45 | 1.64 | -0.81 |
| Nov | 0.26 | 0.05 | -0.21 |
| Dec | 0.08 | 0.02 | -0.06 |
| ⌀ Month | 2.46 | 1.89 | -0.57 |
Snow (mm)
| Month | ⌀ 1940 - 1950 | ⌀ 2013 - 2023 | +/- |
|---|---|---|---|
| Jan | 0.00 | 0.00 | 0.00 |
| Feb | 0.00 | 0.00 | 0.00 |
| Mar | 0.00 | 0.00 | 0.00 |
| Apr | 0.00 | 0.00 | 0.00 |
| May | 0.00 | 0.00 | 0.00 |
| Jun | 0.00 | 0.00 | 0.00 |
| Jul | 0.00 | 0.00 | 0.00 |
| Aug | 0.00 | 0.00 | 0.00 |
| Sep | 0.00 | 0.00 | 0.00 |
| Oct | 0.00 | 0.00 | 0.00 |
| Nov | 0.00 | 0.00 | 0.00 |
| Dec | 0.00 | 0.00 | 0.00 |
| ⌀ Month | 0.00 | 0.00 | 0.00 |