Climate Change Chart of Wuhan, China
Comprehensive Climate Change Chart of Wuhan, China: Monthly Averages and Impact Trends
Explore the climate and weather patterns in Wuhan, China, with insights from historical data. Discover how temperatures, rainfall, snowfall, and sunshine duration have evolved over the years.
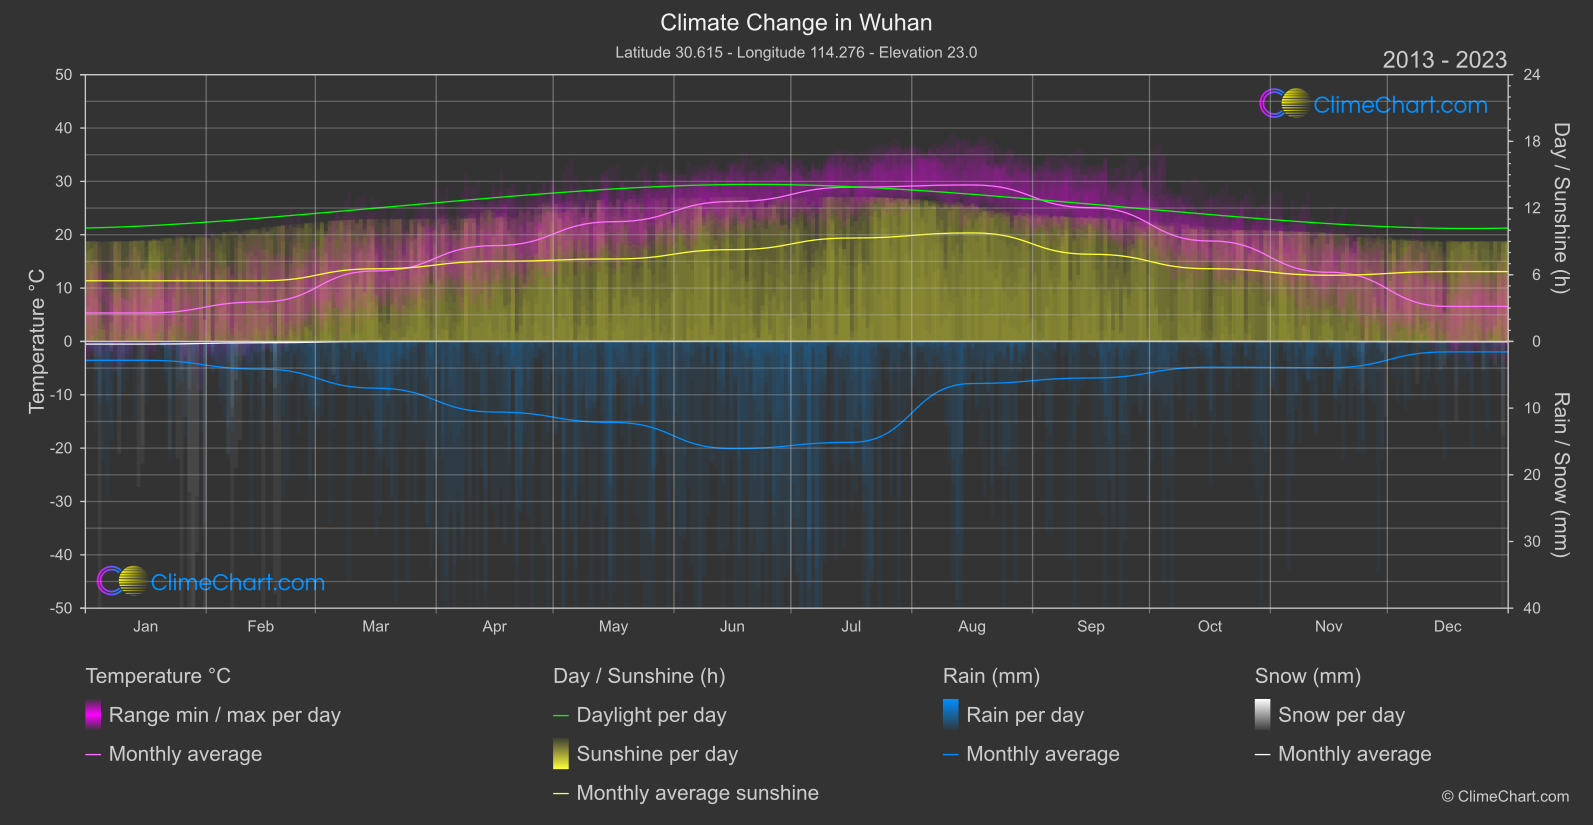
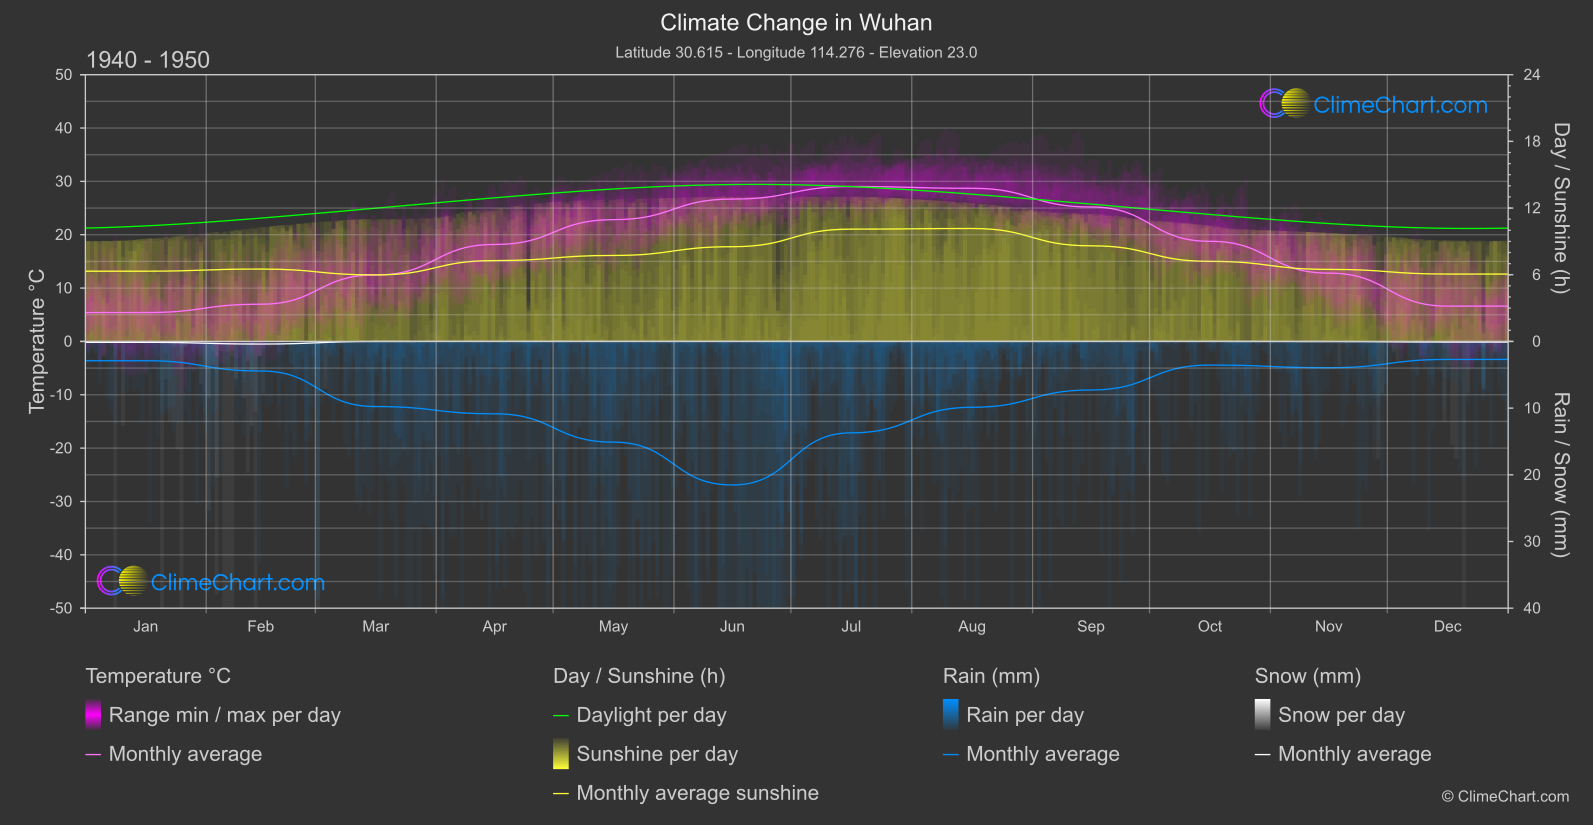
In Wuhan, China, the data shows interesting shifts in climate indicators over the years. The month of February stands out with a significant increase in temperature from 6.98°C in the 1940s to 7.40°C in recent years. On the other hand, June experienced a decrease in temperature from 26.68°C to 26.23°C. In terms of rainfall, June saw the most substantial drop from 10.76mm to 8.04mm. The sunshine duration in July decreased notably from 10.10 hours to 9.30 hours. These changes reflect the ongoing climate transformation in Wuhan.
Climate Change Data Overview for Wuhan, China
Explore the comprehensive climate change data for Wuhan, China. This detailed table provides valuable insights into temperature variations, precipitation levels, and seasonal changes influenced by climate change, helping you understand the unique weather patterns of this region.
Temperature °C
| Month | ⌀ 1940 - 1950 | ⌀ 2013 - 2023 | +/- |
|---|---|---|---|
| Jan | 5.41 | 5.33 | -0.08 |
| Feb | 6.98 | 7.40 | 0.43 |
| Mar | 12.47 | 13.21 | 0.75 |
| Apr | 18.18 | 17.96 | -0.22 |
| May | 22.83 | 22.44 | -0.39 |
| Jun | 26.68 | 26.23 | -0.45 |
| Jul | 29.04 | 28.92 | -0.12 |
| Aug | 28.70 | 29.33 | 0.63 |
| Sep | 25.20 | 25.06 | -0.14 |
| Oct | 18.77 | 18.83 | 0.06 |
| Nov | 12.80 | 12.97 | 0.17 |
| Dec | 6.62 | 6.56 | -0.06 |
| ⌀ Month | 17.81 | 17.85 | 0.05 |
Sunshine (h)
| Month | ⌀ 1940 - 1950 | ⌀ 2013 - 2023 | +/- |
|---|---|---|---|
| Jan | 6.32 | 5.46 | -0.86 |
| Feb | 6.51 | 5.46 | -1.06 |
| Mar | 5.98 | 6.54 | 0.55 |
| Apr | 7.27 | 7.21 | -0.07 |
| May | 7.74 | 7.42 | -0.32 |
| Jun | 8.52 | 8.26 | -0.26 |
| Jul | 10.10 | 9.30 | -0.80 |
| Aug | 10.16 | 9.76 | -0.40 |
| Sep | 8.60 | 7.84 | -0.76 |
| Oct | 7.20 | 6.54 | -0.66 |
| Nov | 6.48 | 5.96 | -0.53 |
| Dec | 6.06 | 6.28 | 0.22 |
| ⌀ Month | 7.58 | 7.17 | -0.41 |
Rain (mm)
| Month | ⌀ 1940 - 1950 | ⌀ 2013 - 2023 | +/- |
|---|---|---|---|
| Jan | 1.45 | 1.42 | -0.03 |
| Feb | 2.22 | 2.07 | -0.14 |
| Mar | 4.88 | 3.50 | -1.38 |
| Apr | 5.43 | 5.29 | -0.13 |
| May | 7.55 | 6.08 | -1.48 |
| Jun | 10.76 | 8.04 | -2.73 |
| Jul | 6.85 | 7.57 | 0.71 |
| Aug | 4.94 | 3.16 | -1.78 |
| Sep | 3.64 | 2.74 | -0.90 |
| Oct | 1.77 | 1.93 | 0.16 |
| Nov | 1.97 | 1.97 | -0.00 |
| Dec | 1.35 | 0.78 | -0.56 |
| ⌀ Month | 4.40 | 3.71 | -0.69 |
Snow (mm)
| Month | ⌀ 1940 - 1950 | ⌀ 2013 - 2023 | +/- |
|---|---|---|---|
| Jan | 0.07 | 0.20 | 0.13 |
| Feb | 0.20 | 0.10 | -0.10 |
| Mar | 0.00 | 0.00 | -0.00 |
| Apr | 0.00 | 0.00 | 0.00 |
| May | 0.00 | 0.00 | 0.00 |
| Jun | 0.00 | 0.00 | 0.00 |
| Jul | 0.00 | 0.00 | 0.00 |
| Aug | 0.00 | 0.00 | 0.00 |
| Sep | 0.00 | 0.00 | 0.00 |
| Oct | 0.00 | 0.00 | 0.00 |
| Nov | 0.01 | 0.01 | -0.00 |
| Dec | 0.05 | 0.03 | -0.02 |
| ⌀ Month | 0.03 | 0.03 | 0.00 |