Climate Change Chart of Washington D.C., USA
Comprehensive Climate Change Chart of Washington D.C., USA: Monthly Averages and Impact Trends
Explore the changing climate in Washington D.C., United States of America through insightful data analysis.
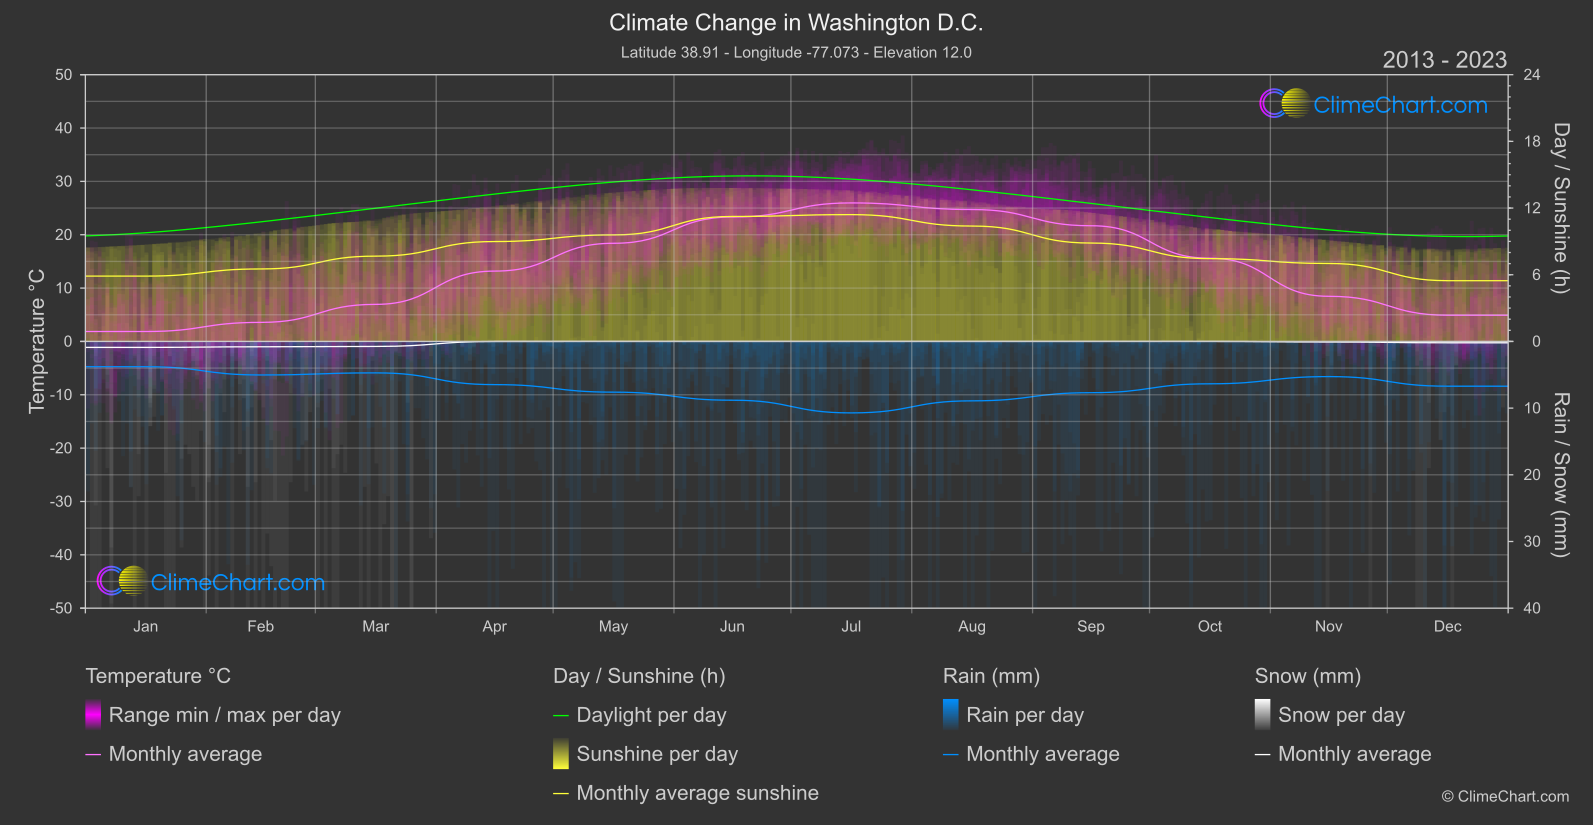
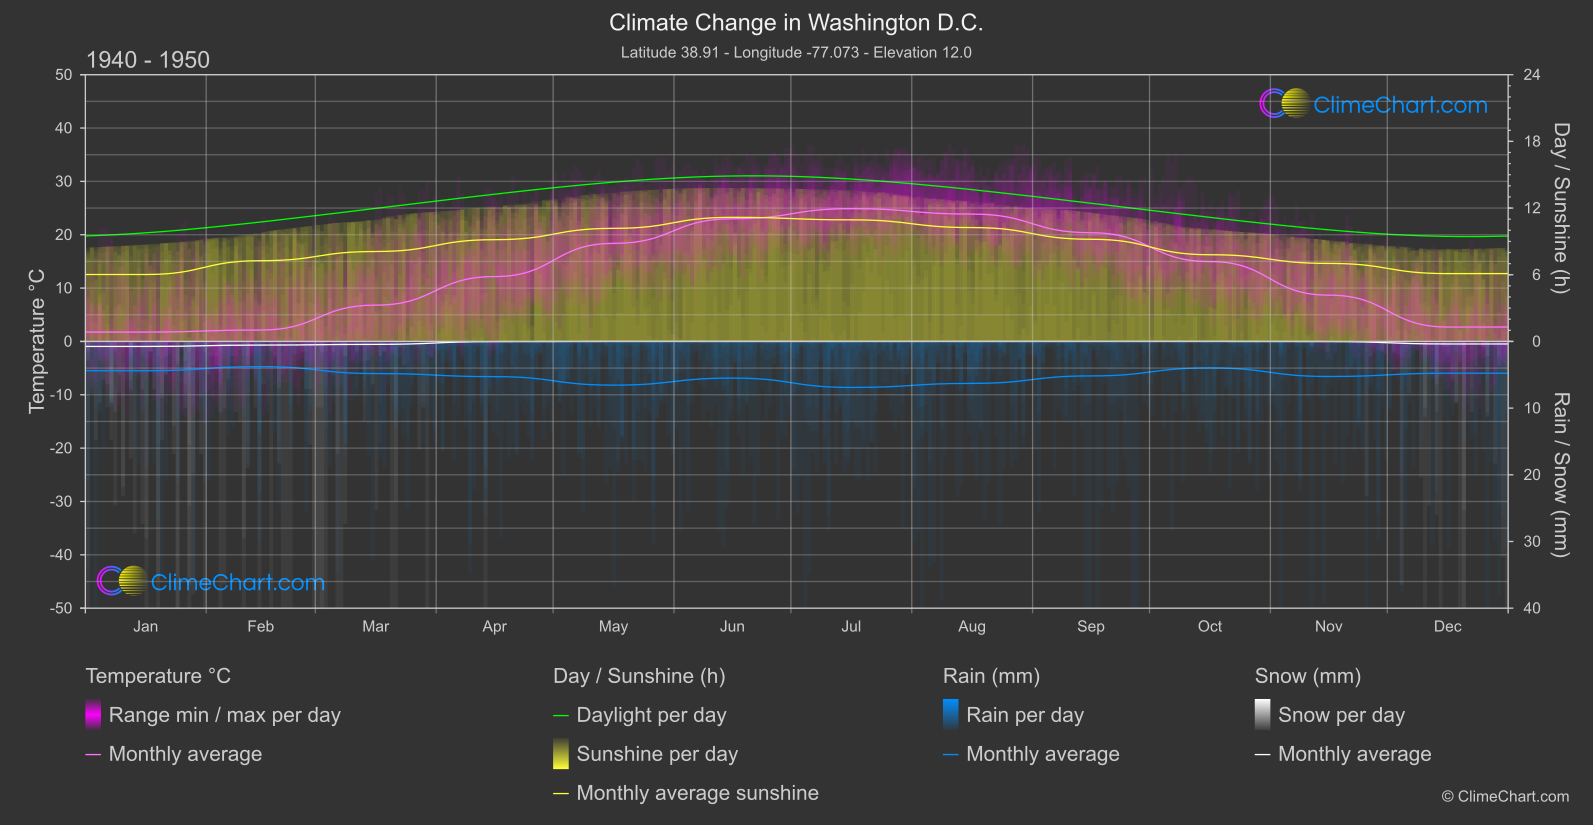
Washington D.C., the capital city of the United States, experiences notable shifts in temperature, rainfall, snowfall, and sunshine duration over the years. Analyzing the data from 1940 to 1950 and comparing it to the period between 2013 and 2024 reveals interesting patterns. For instance, the month with the highest temperature change is December, showing an increase of 2.215°C. In terms of rainfall, July exhibits the most substantial change, with a 1.909 mm increase. Snowfall remains minimal in most months but sees a slight increase in November. Sunshine duration fluctuates across months, with July showing the highest increase of 0.469 hours. These insights shed light on the evolving climate dynamics in Washington D.C.
Climate Change Data Overview for Washington D.C., USA
Explore the comprehensive climate change data for Washington D.C., USA. This detailed table provides valuable insights into temperature variations, precipitation levels, and seasonal changes influenced by climate change, helping you understand the unique weather patterns of this region.
Temperature °C
| Month | ⌀ 1940 - 1950 | ⌀ 2013 - 2023 | +/- |
|---|---|---|---|
| Jan | 1.75 | 1.86 | 0.11 |
| Feb | 2.14 | 3.57 | 1.44 |
| Mar | 6.81 | 6.95 | 0.14 |
| Apr | 12.16 | 13.18 | 1.03 |
| May | 18.38 | 18.40 | 0.02 |
| Jun | 22.99 | 23.32 | 0.33 |
| Jul | 24.88 | 25.96 | 1.08 |
| Aug | 23.87 | 24.72 | 0.86 |
| Sep | 20.38 | 21.69 | 1.31 |
| Oct | 14.97 | 15.60 | 0.63 |
| Nov | 8.67 | 8.46 | -0.21 |
| Dec | 2.70 | 4.91 | 2.22 |
| ⌀ Month | 13.31 | 14.05 | 0.74 |
Sunshine (h)
| Month | ⌀ 1940 - 1950 | ⌀ 2013 - 2023 | +/- |
|---|---|---|---|
| Jan | 6.02 | 5.88 | -0.14 |
| Feb | 7.26 | 6.52 | -0.74 |
| Mar | 8.09 | 7.67 | -0.42 |
| Apr | 9.16 | 8.99 | -0.17 |
| May | 10.17 | 9.58 | -0.59 |
| Jun | 11.17 | 11.24 | 0.08 |
| Jul | 10.94 | 11.41 | 0.47 |
| Aug | 10.24 | 10.38 | 0.14 |
| Sep | 9.19 | 8.85 | -0.34 |
| Oct | 7.80 | 7.45 | -0.35 |
| Nov | 7.02 | 7.01 | -0.01 |
| Dec | 6.10 | 5.47 | -0.64 |
| ⌀ Month | 8.60 | 8.37 | -0.23 |
Rain (mm)
| Month | ⌀ 1940 - 1950 | ⌀ 2013 - 2023 | +/- |
|---|---|---|---|
| Jan | 2.20 | 1.90 | -0.30 |
| Feb | 1.89 | 2.51 | 0.63 |
| Mar | 2.41 | 2.36 | -0.05 |
| Apr | 2.64 | 3.24 | 0.60 |
| May | 3.28 | 3.80 | 0.53 |
| Jun | 2.75 | 4.41 | 1.66 |
| Jul | 3.45 | 5.36 | 1.91 |
| Aug | 3.15 | 4.45 | 1.31 |
| Sep | 2.59 | 3.84 | 1.26 |
| Oct | 1.99 | 3.18 | 1.19 |
| Nov | 2.63 | 2.64 | 0.01 |
| Dec | 2.38 | 3.36 | 0.97 |
| ⌀ Month | 2.61 | 3.42 | 0.81 |
Snow (mm)
| Month | ⌀ 1940 - 1950 | ⌀ 2013 - 2023 | +/- |
|---|---|---|---|
| Jan | 0.37 | 0.45 | 0.07 |
| Feb | 0.27 | 0.40 | 0.13 |
| Mar | 0.22 | 0.38 | 0.16 |
| Apr | 0.01 | 0.00 | -0.01 |
| May | 0.00 | 0.00 | 0.00 |
| Jun | 0.00 | 0.00 | 0.00 |
| Jul | 0.00 | 0.00 | 0.00 |
| Aug | 0.00 | 0.00 | 0.00 |
| Sep | 0.00 | 0.00 | 0.00 |
| Oct | 0.00 | 0.00 | 0.00 |
| Nov | 0.01 | 0.04 | 0.03 |
| Dec | 0.19 | 0.10 | -0.09 |
| ⌀ Month | 0.09 | 0.11 | 0.02 |