Climate Change Chart of Vail, USA
Comprehensive Climate Change Chart of Vail, USA: Monthly Averages and Impact Trends
Discover the changing climate in Vail, USA, through insightful data analysis.
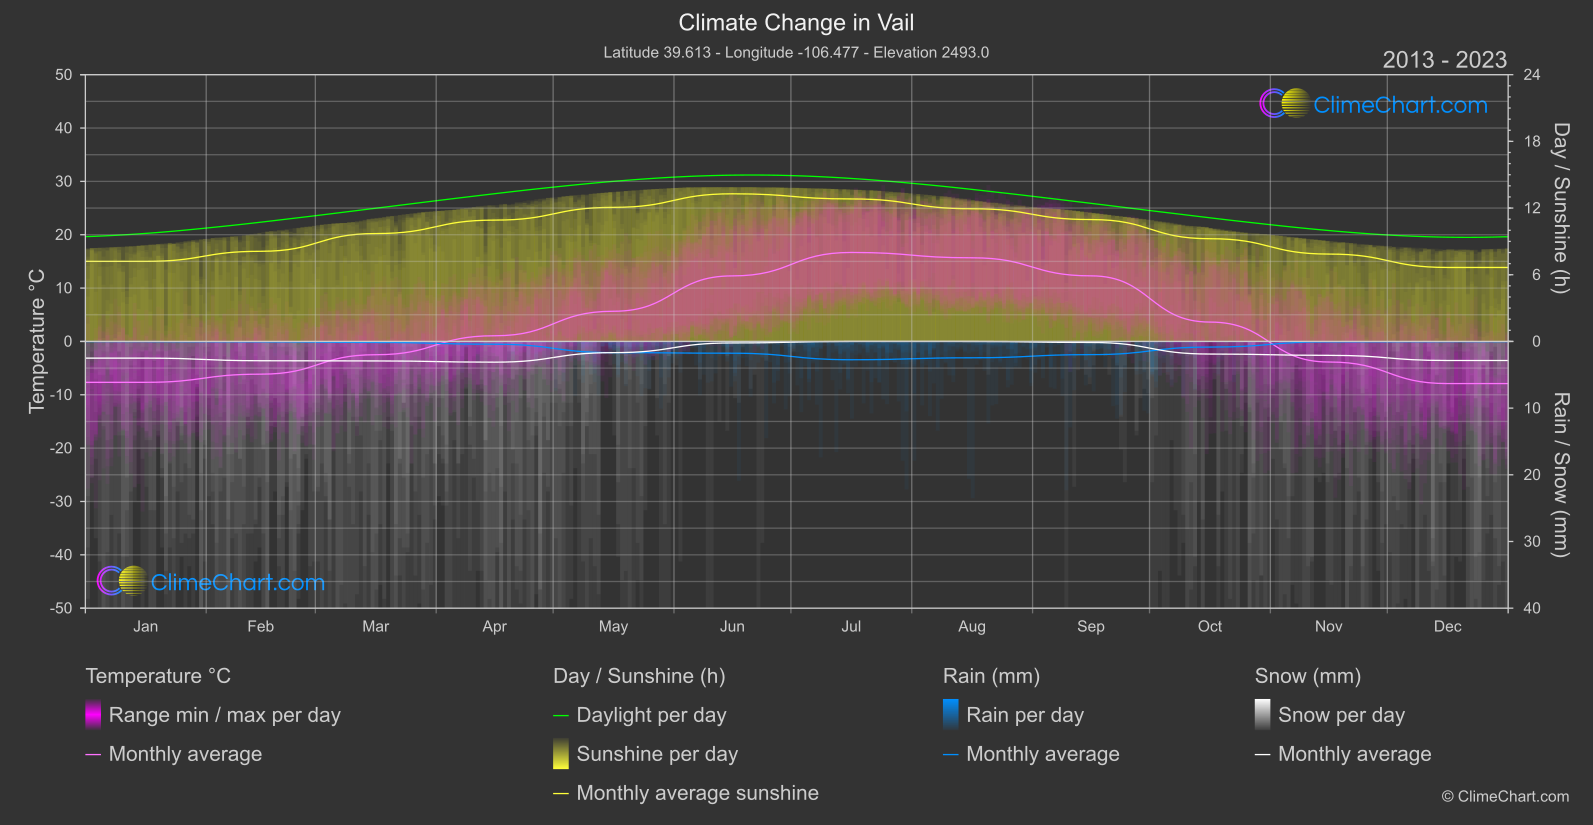
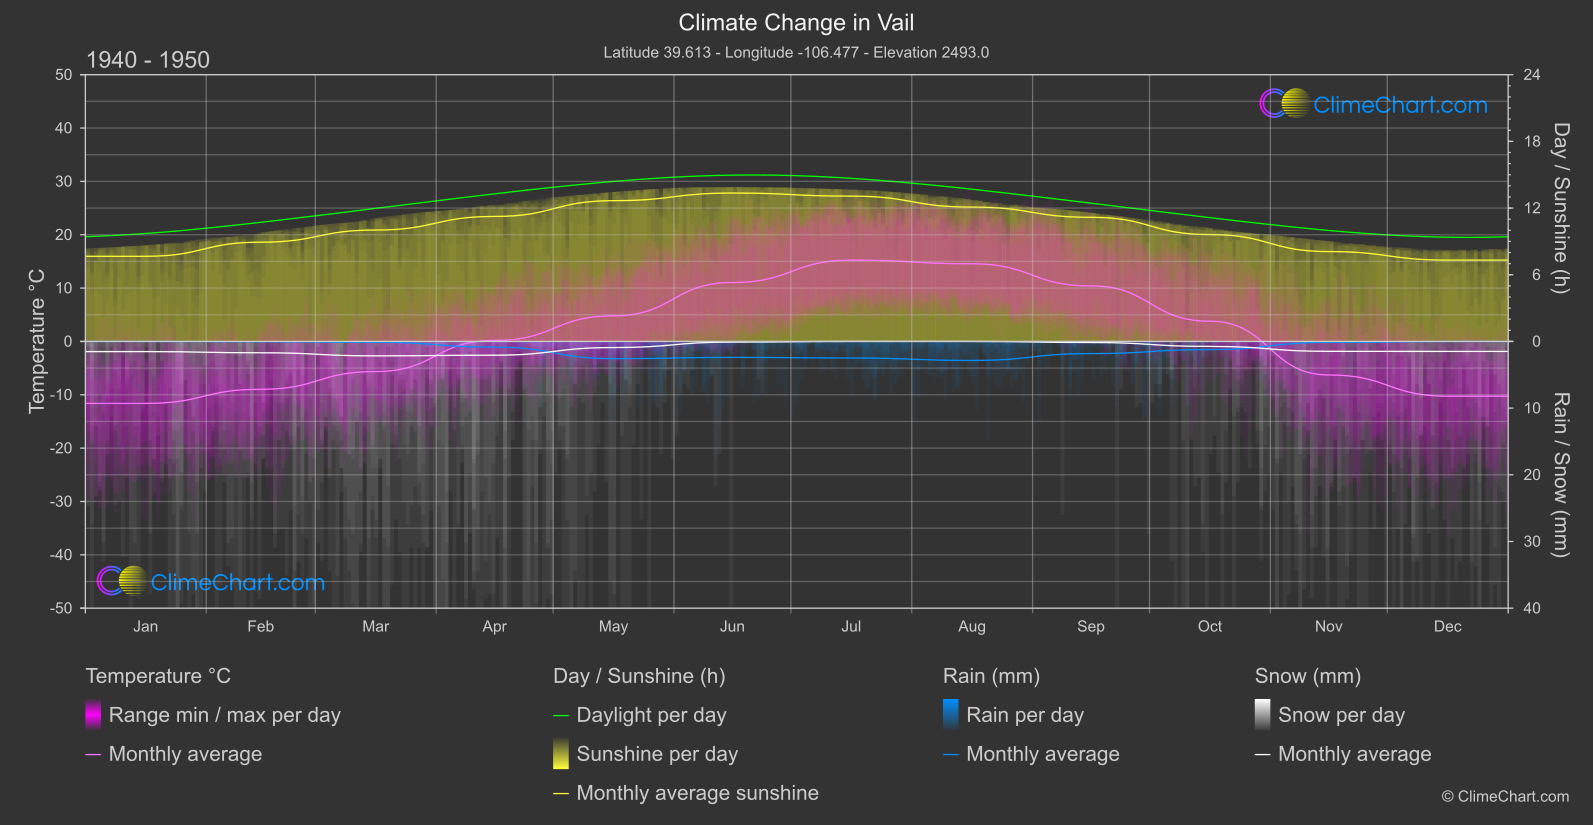
Vail, USA, has experienced significant changes in temperature, rainfall, snowfall, and sunshine duration over the years. From the data analysis, it is evident that the month with the highest temperature change is July, with an increase of 1.44°C. In terms of rainfall, the month with the most significant change is April, with a decrease of 0.22 mm. Snowfall has notably increased in October, with a change of 0.57 mm. Moreover, the sunshine duration has decreased the most in December, by 0.66 hours. These insights shed light on the impact of climate change in Vail, USA.
Climate Change Data Overview for Vail, USA
Explore the comprehensive climate change data for Vail, USA. This detailed table provides valuable insights into temperature variations, precipitation levels, and seasonal changes influenced by climate change, helping you understand the unique weather patterns of this region.
Temperature °C
| Month | ⌀ 1940 - 1950 | ⌀ 2013 - 2023 | +/- |
|---|---|---|---|
| Jan | -11.62 | -7.67 | 3.95 |
| Feb | -8.97 | -6.14 | 2.84 |
| Mar | -5.65 | -2.49 | 3.16 |
| Apr | 0.18 | 1.06 | 0.88 |
| May | 4.80 | 5.66 | 0.86 |
| Jun | 11.04 | 12.29 | 1.25 |
| Jul | 15.24 | 16.68 | 1.44 |
| Aug | 14.56 | 15.68 | 1.12 |
| Sep | 10.40 | 12.29 | 1.89 |
| Oct | 3.79 | 3.63 | -0.16 |
| Nov | -6.28 | -3.86 | 2.43 |
| Dec | -10.27 | -7.90 | 2.37 |
| ⌀ Month | 1.43 | 3.27 | 1.83 |
Sunshine (h)
| Month | ⌀ 1940 - 1950 | ⌀ 2013 - 2023 | +/- |
|---|---|---|---|
| Jan | 7.66 | 7.20 | -0.46 |
| Feb | 8.93 | 8.11 | -0.82 |
| Mar | 10.02 | 9.70 | -0.32 |
| Apr | 11.25 | 10.92 | -0.33 |
| May | 12.67 | 12.06 | -0.60 |
| Jun | 13.35 | 13.28 | -0.07 |
| Jul | 13.07 | 12.82 | -0.25 |
| Aug | 12.09 | 11.94 | -0.15 |
| Sep | 11.17 | 10.97 | -0.20 |
| Oct | 9.62 | 9.24 | -0.37 |
| Nov | 8.08 | 7.86 | -0.22 |
| Dec | 7.32 | 6.66 | -0.66 |
| ⌀ Month | 10.43 | 10.06 | -0.37 |
Rain (mm)
| Month | ⌀ 1940 - 1950 | ⌀ 2013 - 2023 | +/- |
|---|---|---|---|
| Jan | 0.00 | 0.01 | 0.01 |
| Feb | 0.02 | 0.03 | 0.01 |
| Mar | 0.06 | 0.08 | 0.02 |
| Apr | 0.42 | 0.21 | -0.22 |
| May | 1.29 | 0.84 | -0.45 |
| Jun | 1.20 | 0.88 | -0.31 |
| Jul | 1.24 | 1.37 | 0.13 |
| Aug | 1.42 | 1.23 | -0.20 |
| Sep | 0.91 | 0.99 | 0.08 |
| Oct | 0.61 | 0.42 | -0.19 |
| Nov | 0.07 | 0.03 | -0.04 |
| Dec | 0.01 | 0.01 | 0.01 |
| ⌀ Month | 0.60 | 0.51 | -0.10 |
Snow (mm)
| Month | ⌀ 1940 - 1950 | ⌀ 2013 - 2023 | +/- |
|---|---|---|---|
| Jan | 0.76 | 1.25 | 0.49 |
| Feb | 0.85 | 1.45 | 0.60 |
| Mar | 1.08 | 1.46 | 0.38 |
| Apr | 1.03 | 1.55 | 0.52 |
| May | 0.46 | 0.84 | 0.38 |
| Jun | 0.05 | 0.11 | 0.06 |
| Jul | 0.00 | 0.00 | 0.00 |
| Aug | 0.00 | 0.00 | 0.00 |
| Sep | 0.08 | 0.08 | -0.00 |
| Oct | 0.37 | 0.95 | 0.57 |
| Nov | 0.74 | 1.04 | 0.30 |
| Dec | 0.75 | 1.43 | 0.68 |
| ⌀ Month | 0.52 | 0.85 | 0.33 |