Climate Change Chart of St. Anton, Austria
Comprehensive Climate Change Chart of St. Anton, Austria: Monthly Averages and Impact Trends
Explore the changing climate in St. Anton, Austria through insightful data analysis.
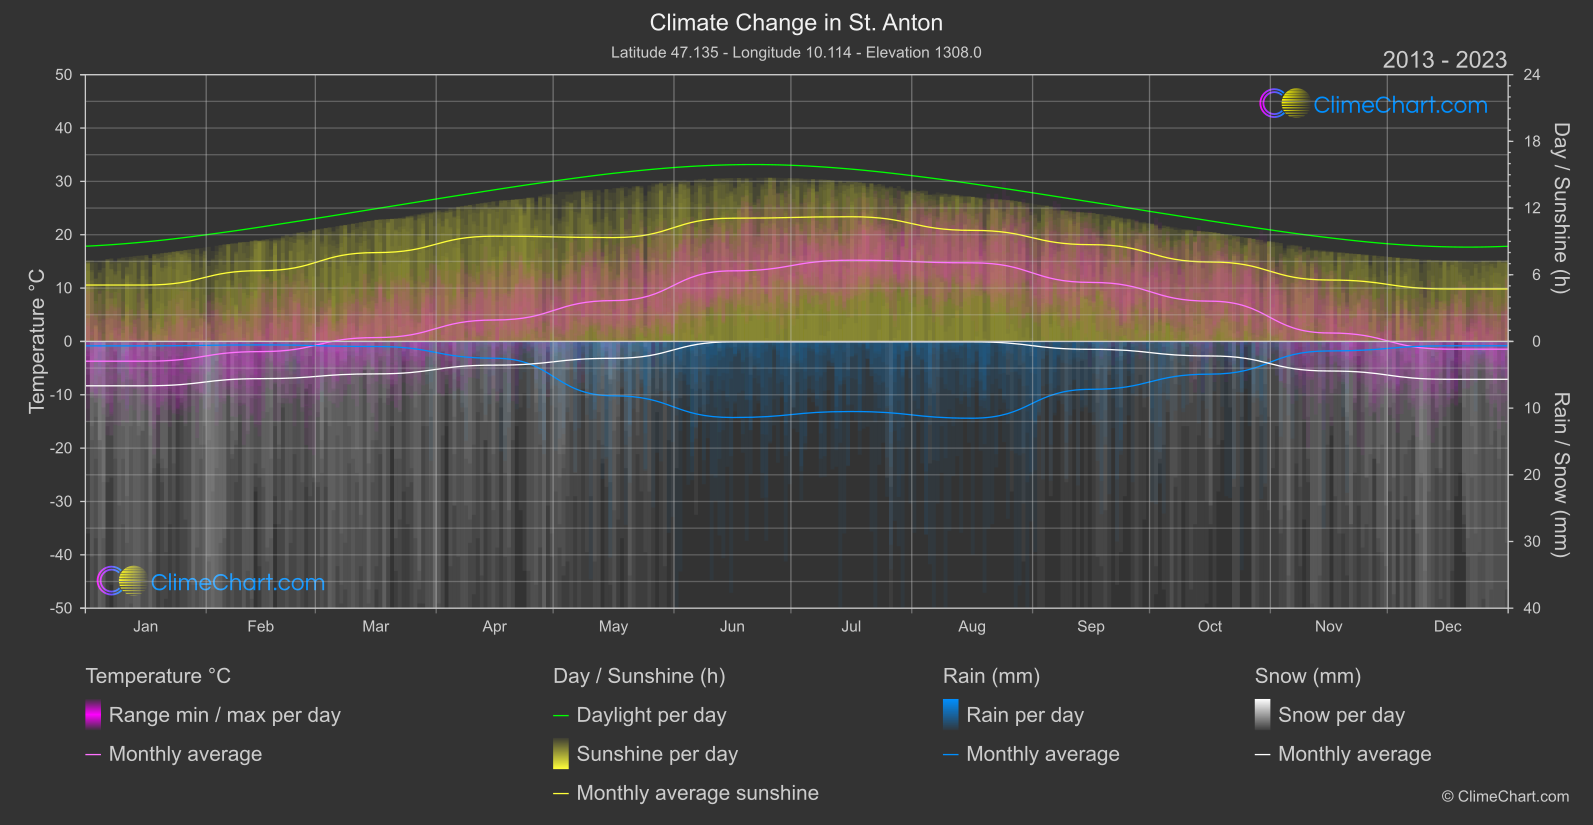
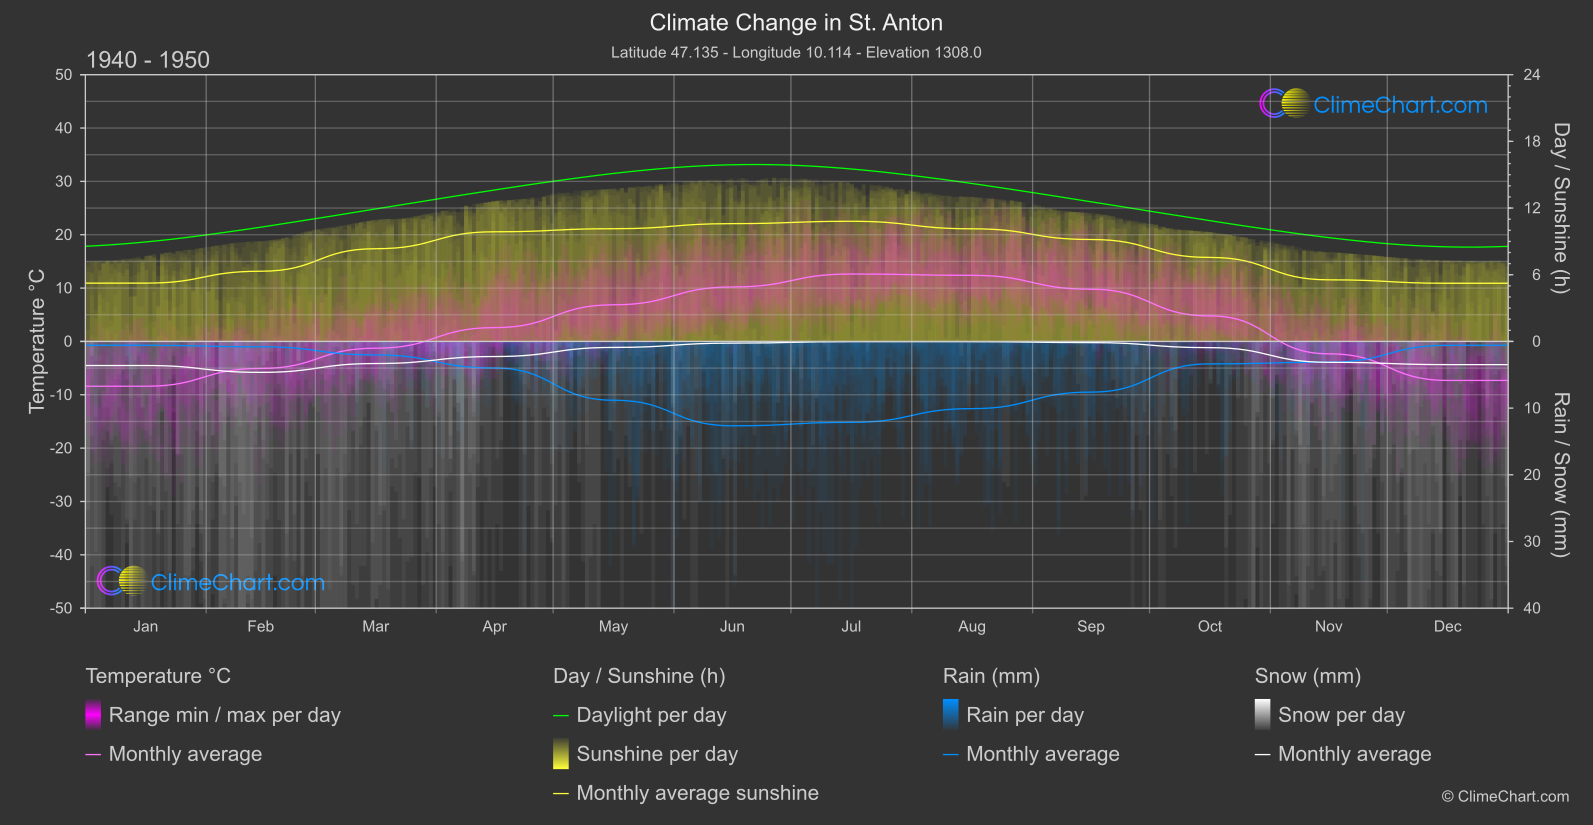
St. Anton, Austria, has experienced significant changes in temperature, rainfall, snowfall, and sunshine duration. From 1940 to 1950 compared to 2013 to 2024, various months showed notable shifts. For instance, January witnessed a temperature increase of 4.69°C and a rainfall increase of 0.04 mm. Explore more insights from the data to understand the evolving climate patterns in St. Anton.
Climate Change Data Overview for St. Anton, Austria
Explore the comprehensive climate change data for St. Anton, Austria. This detailed table provides valuable insights into temperature variations, precipitation levels, and seasonal changes influenced by climate change, helping you understand the unique weather patterns of this region.
Temperature °C
| Month | ⌀ 1940 - 1950 | ⌀ 2013 - 2023 | +/- |
|---|---|---|---|
| Jan | -8.40 | -3.70 | 4.69 |
| Feb | -5.06 | -1.91 | 3.15 |
| Mar | -1.27 | 0.72 | 1.99 |
| Apr | 2.59 | 4.02 | 1.43 |
| May | 6.87 | 7.66 | 0.79 |
| Jun | 10.21 | 13.23 | 3.02 |
| Jul | 12.64 | 15.22 | 2.58 |
| Aug | 12.39 | 14.73 | 2.34 |
| Sep | 9.79 | 11.06 | 1.28 |
| Oct | 4.79 | 7.55 | 2.76 |
| Nov | -2.33 | 1.59 | 3.91 |
| Dec | -7.31 | -1.45 | 5.86 |
| ⌀ Month | 2.91 | 5.73 | 2.82 |
Sunshine (h)
| Month | ⌀ 1940 - 1950 | ⌀ 2013 - 2023 | +/- |
|---|---|---|---|
| Jan | 5.25 | 5.08 | -0.17 |
| Feb | 6.32 | 6.37 | 0.05 |
| Mar | 8.34 | 7.99 | -0.35 |
| Apr | 9.87 | 9.47 | -0.40 |
| May | 10.14 | 9.35 | -0.80 |
| Jun | 10.60 | 11.09 | 0.49 |
| Jul | 10.81 | 11.22 | 0.41 |
| Aug | 10.13 | 9.99 | -0.14 |
| Sep | 9.17 | 8.71 | -0.46 |
| Oct | 7.56 | 7.15 | -0.41 |
| Nov | 5.54 | 5.53 | -0.02 |
| Dec | 5.23 | 4.72 | -0.51 |
| ⌀ Month | 8.25 | 8.05 | -0.19 |
Rain (mm)
| Month | ⌀ 1940 - 1950 | ⌀ 2013 - 2023 | +/- |
|---|---|---|---|
| Jan | 0.29 | 0.33 | 0.04 |
| Feb | 0.40 | 0.26 | -0.14 |
| Mar | 1.01 | 0.38 | -0.63 |
| Apr | 2.00 | 1.26 | -0.74 |
| May | 4.41 | 4.08 | -0.33 |
| Jun | 6.33 | 5.70 | -0.62 |
| Jul | 6.07 | 5.26 | -0.81 |
| Aug | 5.04 | 5.76 | 0.72 |
| Sep | 3.80 | 3.59 | -0.21 |
| Oct | 1.68 | 2.45 | 0.77 |
| Nov | 1.56 | 0.71 | -0.84 |
| Dec | 0.29 | 0.33 | 0.04 |
| ⌀ Month | 2.74 | 2.51 | -0.23 |
Snow (mm)
| Month | ⌀ 1940 - 1950 | ⌀ 2013 - 2023 | +/- |
|---|---|---|---|
| Jan | 1.81 | 3.33 | 1.52 |
| Feb | 2.32 | 2.79 | 0.47 |
| Mar | 1.66 | 2.43 | 0.78 |
| Apr | 1.13 | 1.78 | 0.65 |
| May | 0.45 | 1.26 | 0.81 |
| Jun | 0.13 | 0.03 | -0.10 |
| Jul | 0.01 | 0.03 | 0.02 |
| Aug | 0.02 | 0.03 | 0.01 |
| Sep | 0.09 | 0.59 | 0.50 |
| Oct | 0.47 | 1.09 | 0.62 |
| Nov | 1.57 | 2.22 | 0.65 |
| Dec | 1.74 | 2.84 | 1.10 |
| ⌀ Month | 0.95 | 1.53 | 0.59 |