Climate Change Chart of Santa Fe, USA
Comprehensive Climate Change Chart of Santa Fe, USA: Monthly Averages and Impact Trends
Explore the changing climate patterns in Santa Fe, USA, with insightful data comparisons from the past to recent years.
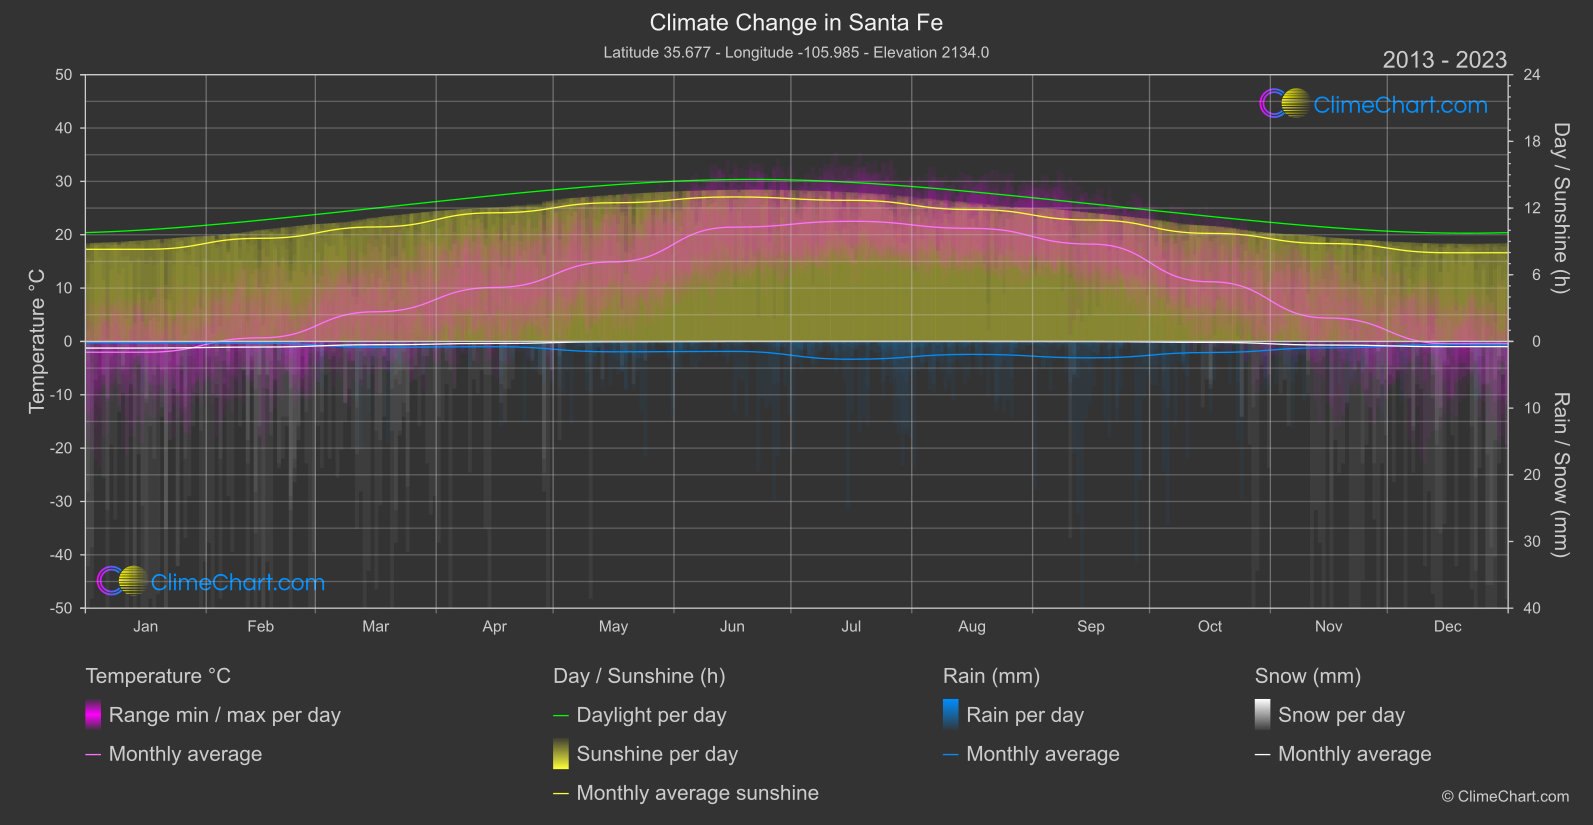
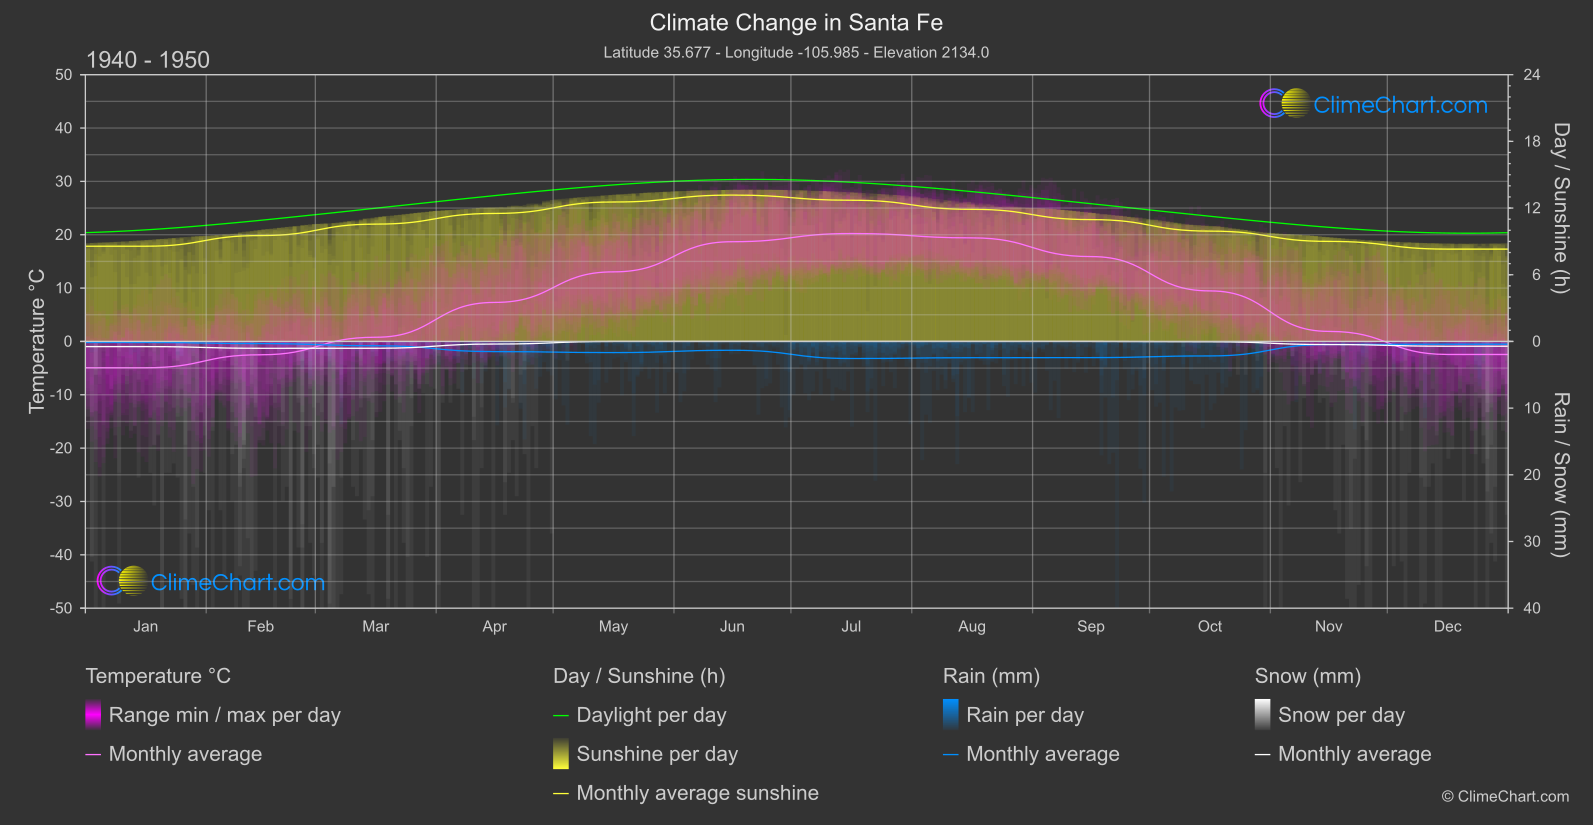
Santa Fe, USA, experiences notable changes in temperature, rainfall, snowfall, and sunshine duration over the years. The data comparison between 1940 - 1950 and 2013 - 2024 provides valuable insights into climate trends. For instance, the month of March shows a significant temperature increase of 4.77°C, indicating warming trends. Similarly, rainfall patterns vary across months, with November experiencing a notable increase in rainfall of 0.25mm. Explore more detailed climate data for Santa Fe to understand the evolving weather patterns.
Climate Change Data Overview for Santa Fe, USA
Explore the comprehensive climate change data for Santa Fe, USA. This detailed table provides valuable insights into temperature variations, precipitation levels, and seasonal changes influenced by climate change, helping you understand the unique weather patterns of this region.
Temperature °C
| Month | ⌀ 1940 - 1950 | ⌀ 2013 - 2023 | +/- |
|---|---|---|---|
| Jan | -4.93 | -2.03 | 2.91 |
| Feb | -2.50 | 0.68 | 3.18 |
| Mar | 0.78 | 5.56 | 4.77 |
| Apr | 7.31 | 10.12 | 2.81 |
| May | 13.04 | 14.92 | 1.88 |
| Jun | 18.69 | 21.41 | 2.72 |
| Jul | 20.23 | 22.52 | 2.30 |
| Aug | 19.41 | 21.20 | 1.78 |
| Sep | 15.91 | 18.25 | 2.34 |
| Oct | 9.47 | 11.19 | 1.71 |
| Nov | 1.88 | 4.38 | 2.50 |
| Dec | -2.44 | -0.43 | 2.01 |
| ⌀ Month | 8.07 | 10.65 | 2.58 |
Sunshine (h)
| Month | ⌀ 1940 - 1950 | ⌀ 2013 - 2023 | +/- |
|---|---|---|---|
| Jan | 8.57 | 8.29 | -0.28 |
| Feb | 9.53 | 9.28 | -0.25 |
| Mar | 10.55 | 10.30 | -0.25 |
| Apr | 11.52 | 11.57 | 0.06 |
| May | 12.54 | 12.48 | -0.07 |
| Jun | 13.17 | 13.00 | -0.17 |
| Jul | 12.70 | 12.69 | -0.01 |
| Aug | 11.89 | 11.87 | -0.02 |
| Sep | 10.96 | 10.93 | -0.04 |
| Oct | 9.93 | 9.72 | -0.20 |
| Nov | 9.00 | 8.81 | -0.19 |
| Dec | 8.30 | 7.98 | -0.33 |
| ⌀ Month | 10.72 | 10.58 | -0.15 |
Rain (mm)
| Month | ⌀ 1940 - 1950 | ⌀ 2013 - 2023 | +/- |
|---|---|---|---|
| Jan | 0.08 | 0.09 | 0.01 |
| Feb | 0.16 | 0.13 | -0.03 |
| Mar | 0.32 | 0.43 | 0.11 |
| Apr | 0.76 | 0.39 | -0.37 |
| May | 0.84 | 0.78 | -0.06 |
| Jun | 0.66 | 0.75 | 0.08 |
| Jul | 1.28 | 1.33 | 0.05 |
| Aug | 1.22 | 0.97 | -0.25 |
| Sep | 1.21 | 1.23 | 0.02 |
| Oct | 1.09 | 0.83 | -0.26 |
| Nov | 0.23 | 0.48 | 0.25 |
| Dec | 0.21 | 0.23 | 0.02 |
| ⌀ Month | 0.67 | 0.64 | -0.04 |
Snow (mm)
| Month | ⌀ 1940 - 1950 | ⌀ 2013 - 2023 | +/- |
|---|---|---|---|
| Jan | 0.39 | 0.50 | 0.11 |
| Feb | 0.51 | 0.42 | -0.09 |
| Mar | 0.51 | 0.25 | -0.26 |
| Apr | 0.20 | 0.15 | -0.04 |
| May | 0.00 | 0.02 | 0.02 |
| Jun | 0.00 | 0.00 | 0.00 |
| Jul | 0.00 | 0.00 | 0.00 |
| Aug | 0.00 | 0.00 | 0.00 |
| Sep | 0.00 | 0.01 | 0.01 |
| Oct | 0.02 | 0.07 | 0.05 |
| Nov | 0.23 | 0.27 | 0.04 |
| Dec | 0.36 | 0.39 | 0.03 |
| ⌀ Month | 0.19 | 0.17 | -0.01 |