Climate Change Chart of San Diego, USA
Comprehensive Climate Change Chart of San Diego, USA: Monthly Averages and Impact Trends
Explore the changing climate in San Diego, USA with insightful data analysis.
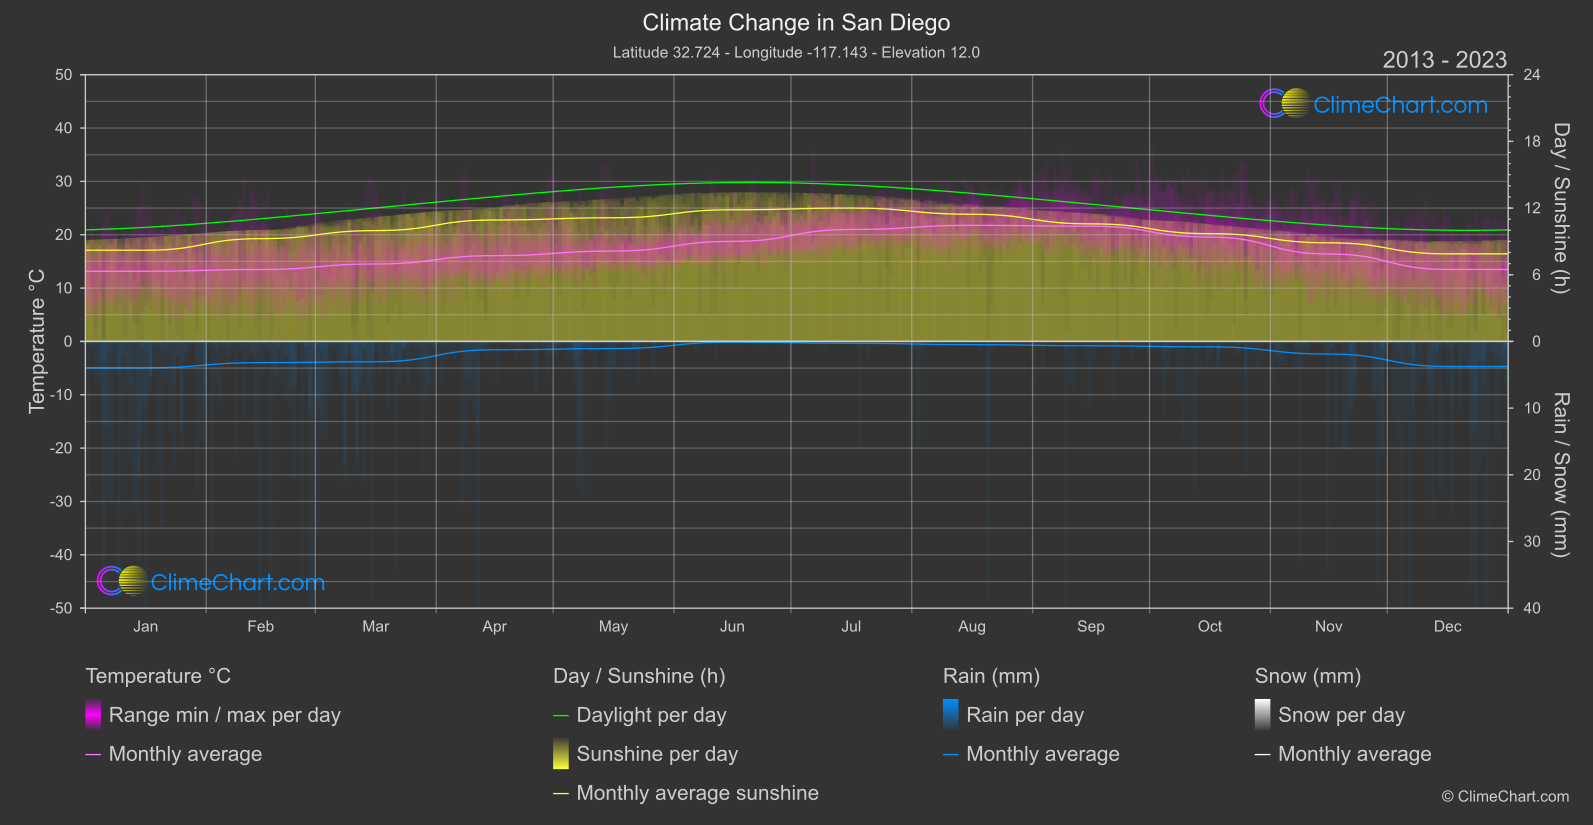
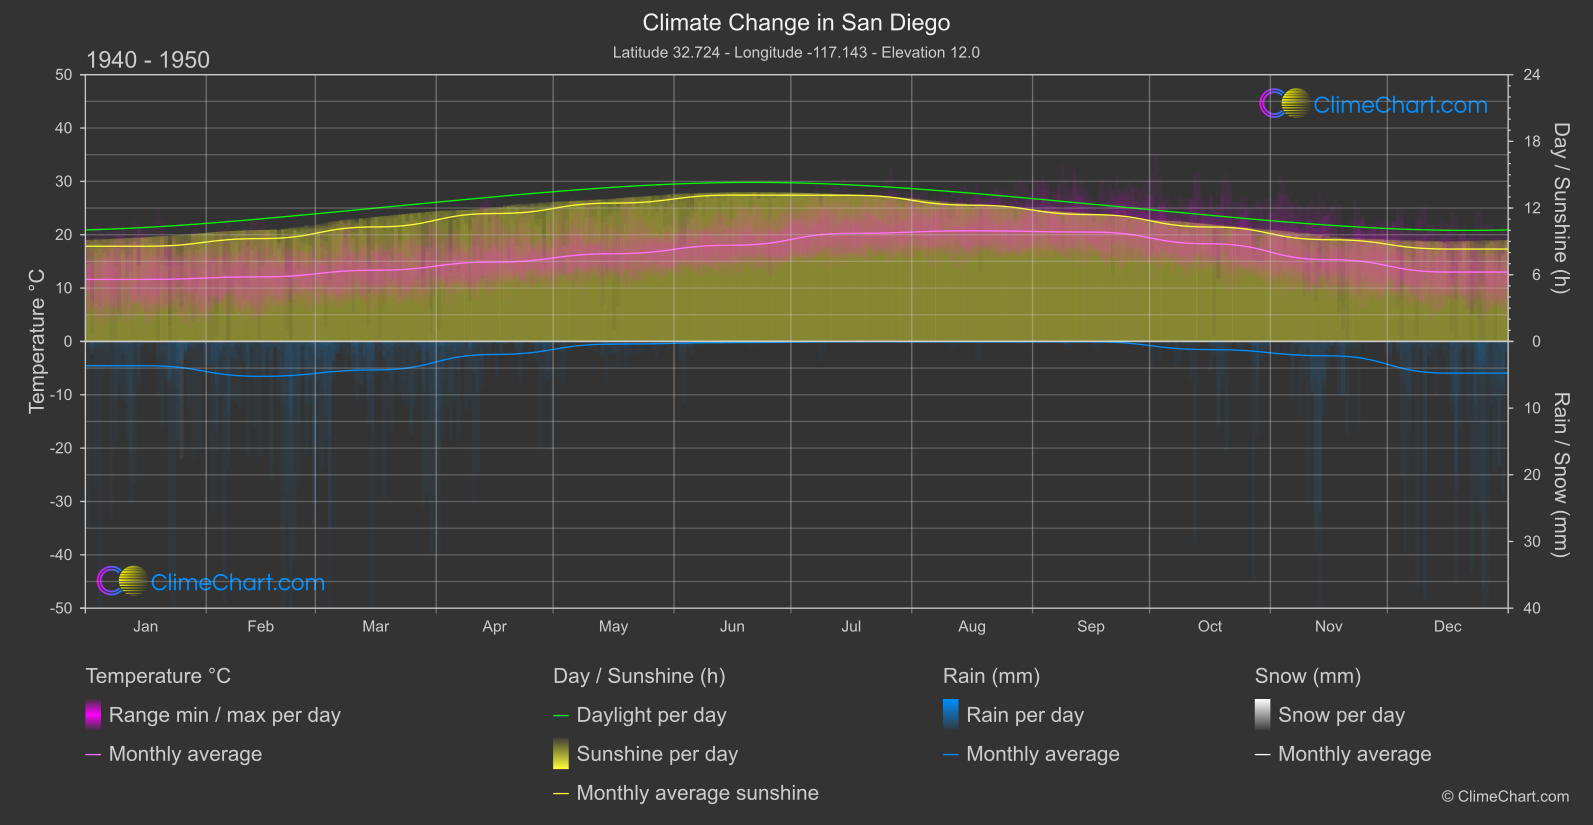
San Diego, located in the United States, has experienced notable changes in climate over the years. The data shows varying trends in temperature, rainfall, snowfall, and sunshine duration between the periods of 1940-1950 and 2013-2024. For instance, the month of October saw a significant increase in temperature, while February experienced a notable decrease in rainfall. Understanding these shifts is crucial for monitoring and adapting to the evolving climate patterns in San Diego.
Climate Change Data Overview for San Diego, USA
Explore the comprehensive climate change data for San Diego, USA. This detailed table provides valuable insights into temperature variations, precipitation levels, and seasonal changes influenced by climate change, helping you understand the unique weather patterns of this region.
Temperature °C
| Month | ⌀ 1940 - 1950 | ⌀ 2013 - 2023 | +/- |
|---|---|---|---|
| Jan | 11.62 | 13.15 | 1.53 |
| Feb | 12.11 | 13.48 | 1.38 |
| Mar | 13.35 | 14.52 | 1.17 |
| Apr | 14.88 | 16.08 | 1.20 |
| May | 16.44 | 16.94 | 0.50 |
| Jun | 18.03 | 18.75 | 0.72 |
| Jul | 20.26 | 20.99 | 0.73 |
| Aug | 20.73 | 21.76 | 1.03 |
| Sep | 20.50 | 21.60 | 1.10 |
| Oct | 18.30 | 19.55 | 1.26 |
| Nov | 15.32 | 16.39 | 1.06 |
| Dec | 13.00 | 13.49 | 0.49 |
| ⌀ Month | 16.21 | 17.23 | 1.01 |
Sunshine (h)
| Month | ⌀ 1940 - 1950 | ⌀ 2013 - 2023 | +/- |
|---|---|---|---|
| Jan | 8.57 | 8.21 | -0.36 |
| Feb | 9.25 | 9.25 | -0.00 |
| Mar | 10.30 | 9.97 | -0.33 |
| Apr | 11.51 | 10.93 | -0.58 |
| May | 12.45 | 11.13 | -1.32 |
| Jun | 13.16 | 11.84 | -1.32 |
| Jul | 13.15 | 12.00 | -1.15 |
| Aug | 12.26 | 11.44 | -0.82 |
| Sep | 11.41 | 10.58 | -0.83 |
| Oct | 10.30 | 9.70 | -0.60 |
| Nov | 9.15 | 8.87 | -0.28 |
| Dec | 8.31 | 7.88 | -0.44 |
| ⌀ Month | 10.82 | 10.15 | -0.67 |
Rain (mm)
| Month | ⌀ 1940 - 1950 | ⌀ 2013 - 2023 | +/- |
|---|---|---|---|
| Jan | 1.82 | 1.98 | 0.16 |
| Feb | 2.61 | 1.59 | -1.03 |
| Mar | 2.14 | 1.52 | -0.61 |
| Apr | 0.97 | 0.63 | -0.35 |
| May | 0.20 | 0.53 | 0.33 |
| Jun | 0.09 | 0.05 | -0.03 |
| Jul | 0.02 | 0.14 | 0.12 |
| Aug | 0.03 | 0.24 | 0.21 |
| Sep | 0.03 | 0.33 | 0.30 |
| Oct | 0.61 | 0.41 | -0.20 |
| Nov | 1.08 | 0.95 | -0.13 |
| Dec | 2.38 | 1.88 | -0.50 |
| ⌀ Month | 1.00 | 0.85 | -0.14 |
Snow (mm)
| Month | ⌀ 1940 - 1950 | ⌀ 2013 - 2023 | +/- |
|---|---|---|---|
| Jan | 0.01 | 0.00 | -0.01 |
| Feb | 0.00 | 0.00 | 0.00 |
| Mar | 0.00 | 0.00 | 0.00 |
| Apr | 0.00 | 0.00 | 0.00 |
| May | 0.00 | 0.00 | 0.00 |
| Jun | 0.00 | 0.00 | 0.00 |
| Jul | 0.00 | 0.00 | 0.00 |
| Aug | 0.00 | 0.00 | 0.00 |
| Sep | 0.00 | 0.00 | 0.00 |
| Oct | 0.00 | 0.00 | 0.00 |
| Nov | 0.00 | 0.00 | 0.00 |
| Dec | 0.00 | 0.00 | 0.00 |
| ⌀ Month | 0.00 | 0.00 | -0.00 |