Climate Change Chart of Rabat, Morocco
Comprehensive Climate Change Chart of Rabat, Morocco: Monthly Averages and Impact Trends
Explore the changing climate in Rabat, Morocco, with insights on temperature, rainfall, and sunshine duration over the years.
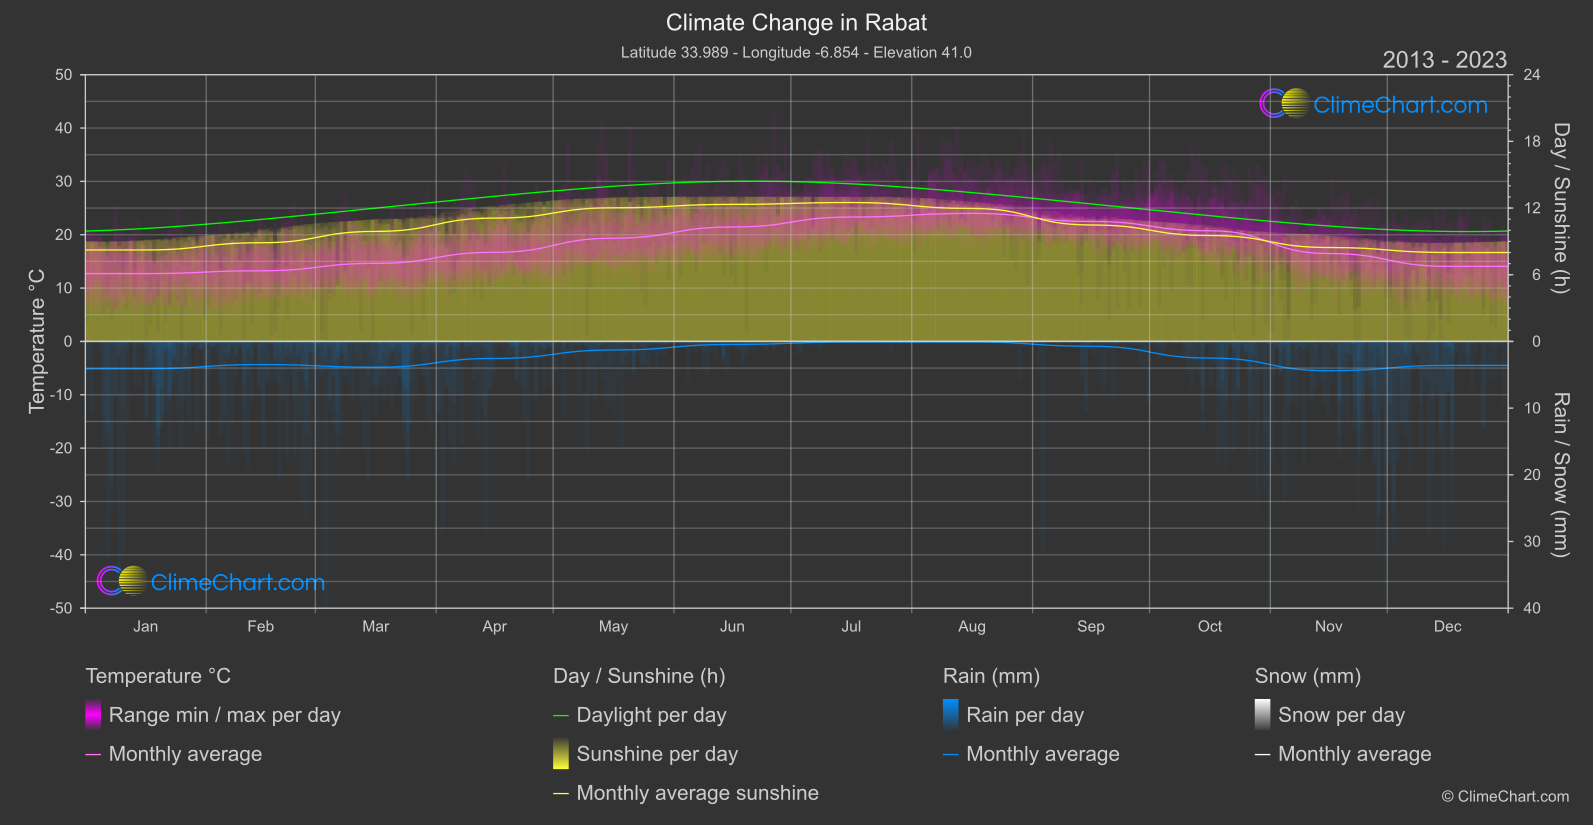
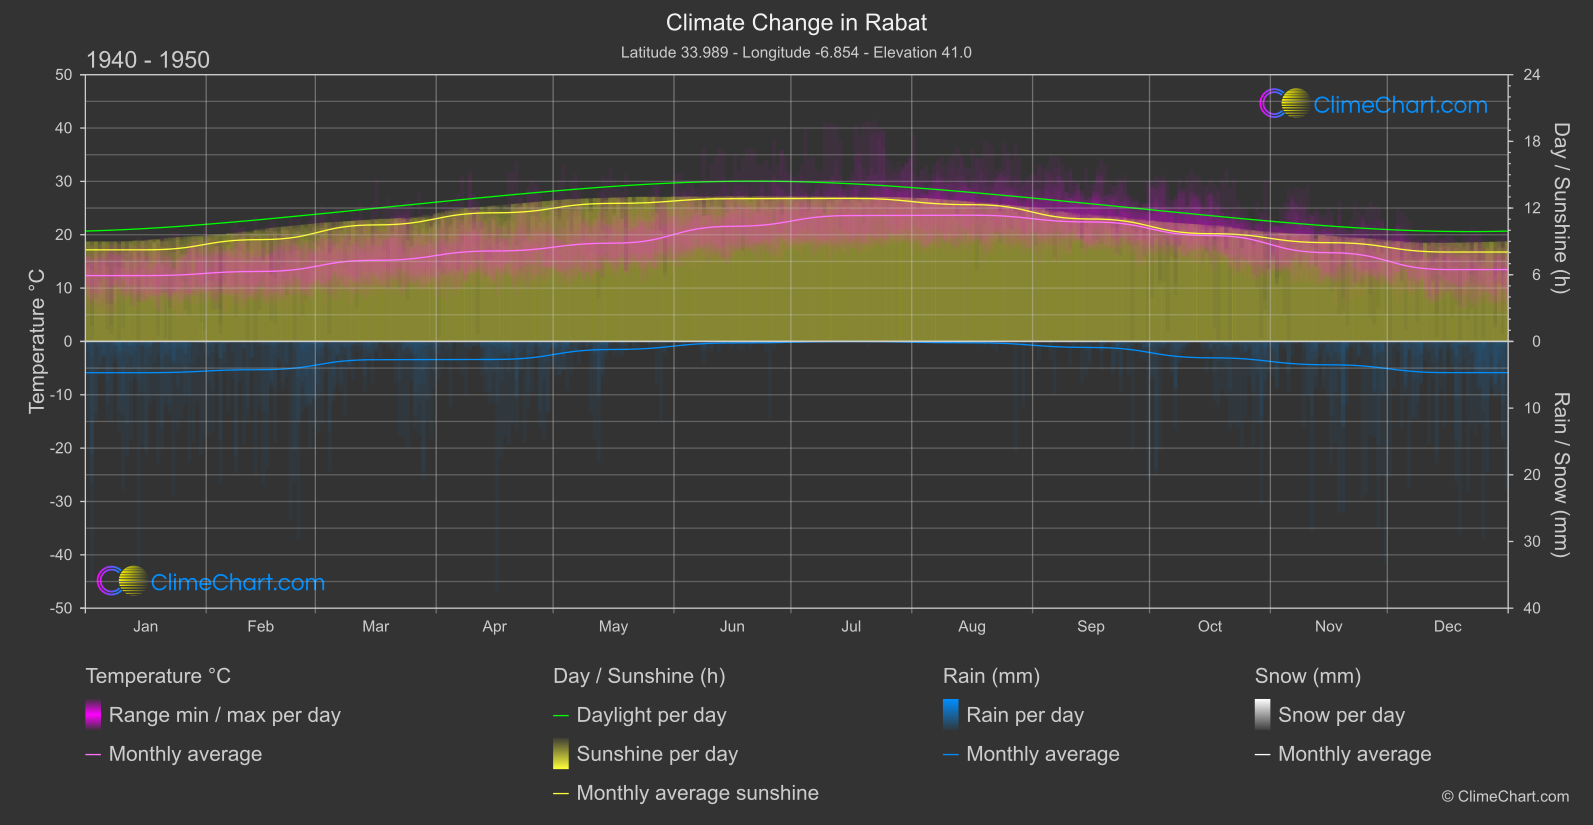
Rabat, the capital city of Morocco, has experienced notable changes in climate over the years. The data showcases temperature variations, rainfall patterns, and sunshine duration comparing the periods of 1940-1950 and 2013-2024. Noteworthy insights include the month of May having the highest temperature increase and November experiencing the most significant rise in rainfall. The sunshine duration has shown a decreasing trend over the years, with March and June recording the most considerable reductions.
Climate Change Data Overview for Rabat, Morocco
Explore the comprehensive climate change data for Rabat, Morocco. This detailed table provides valuable insights into temperature variations, precipitation levels, and seasonal changes influenced by climate change, helping you understand the unique weather patterns of this region.
Temperature °C
| Month | ⌀ 1940 - 1950 | ⌀ 2013 - 2023 | +/- |
|---|---|---|---|
| Jan | 12.34 | 12.71 | 0.37 |
| Feb | 13.12 | 13.24 | 0.12 |
| Mar | 15.21 | 14.63 | -0.58 |
| Apr | 16.96 | 16.70 | -0.26 |
| May | 18.42 | 19.35 | 0.93 |
| Jun | 21.58 | 21.45 | -0.13 |
| Jul | 23.60 | 23.32 | -0.28 |
| Aug | 23.66 | 24.00 | 0.35 |
| Sep | 22.39 | 22.49 | 0.10 |
| Oct | 19.84 | 20.74 | 0.90 |
| Nov | 16.63 | 16.47 | -0.16 |
| Dec | 13.47 | 14.07 | 0.60 |
| ⌀ Month | 18.10 | 18.27 | 0.16 |
Sunshine (h)
| Month | ⌀ 1940 - 1950 | ⌀ 2013 - 2023 | +/- |
|---|---|---|---|
| Jan | 8.24 | 8.23 | -0.01 |
| Feb | 9.16 | 8.88 | -0.29 |
| Mar | 10.48 | 9.90 | -0.59 |
| Apr | 11.57 | 11.10 | -0.48 |
| May | 12.42 | 12.02 | -0.40 |
| Jun | 12.84 | 12.33 | -0.51 |
| Jul | 12.87 | 12.50 | -0.37 |
| Aug | 12.30 | 11.96 | -0.34 |
| Sep | 11.02 | 10.48 | -0.54 |
| Oct | 9.70 | 9.53 | -0.17 |
| Nov | 8.89 | 8.45 | -0.44 |
| Dec | 8.04 | 8.00 | -0.04 |
| ⌀ Month | 10.63 | 10.28 | -0.35 |
Rain (mm)
| Month | ⌀ 1940 - 1950 | ⌀ 2013 - 2023 | +/- |
|---|---|---|---|
| Jan | 2.35 | 2.05 | -0.30 |
| Feb | 2.12 | 1.73 | -0.38 |
| Mar | 1.37 | 1.93 | 0.56 |
| Apr | 1.35 | 1.27 | -0.08 |
| May | 0.60 | 0.64 | 0.04 |
| Jun | 0.11 | 0.22 | 0.11 |
| Jul | 0.00 | 0.04 | 0.04 |
| Aug | 0.10 | 0.04 | -0.07 |
| Sep | 0.45 | 0.36 | -0.09 |
| Oct | 1.23 | 1.25 | 0.02 |
| Nov | 1.75 | 2.20 | 0.44 |
| Dec | 2.34 | 1.80 | -0.54 |
| ⌀ Month | 1.15 | 1.13 | -0.02 |
Snow (mm)
| Month | ⌀ 1940 - 1950 | ⌀ 2013 - 2023 | +/- |
|---|---|---|---|
| Jan | 0.00 | 0.00 | 0.00 |
| Feb | 0.00 | 0.00 | 0.00 |
| Mar | 0.00 | 0.00 | 0.00 |
| Apr | 0.00 | 0.00 | 0.00 |
| May | 0.00 | 0.00 | 0.00 |
| Jun | 0.00 | 0.00 | 0.00 |
| Jul | 0.00 | 0.00 | 0.00 |
| Aug | 0.00 | 0.00 | 0.00 |
| Sep | 0.00 | 0.00 | 0.00 |
| Oct | 0.00 | 0.00 | 0.00 |
| Nov | 0.00 | 0.00 | 0.00 |
| Dec | 0.00 | 0.00 | 0.00 |
| ⌀ Month | 0.00 | 0.00 | 0.00 |