Climate Change Chart of Phoenix, USA
Comprehensive Climate Change Chart of Phoenix, USA: Monthly Averages and Impact Trends
Exploring the climate change in Phoenix, USA
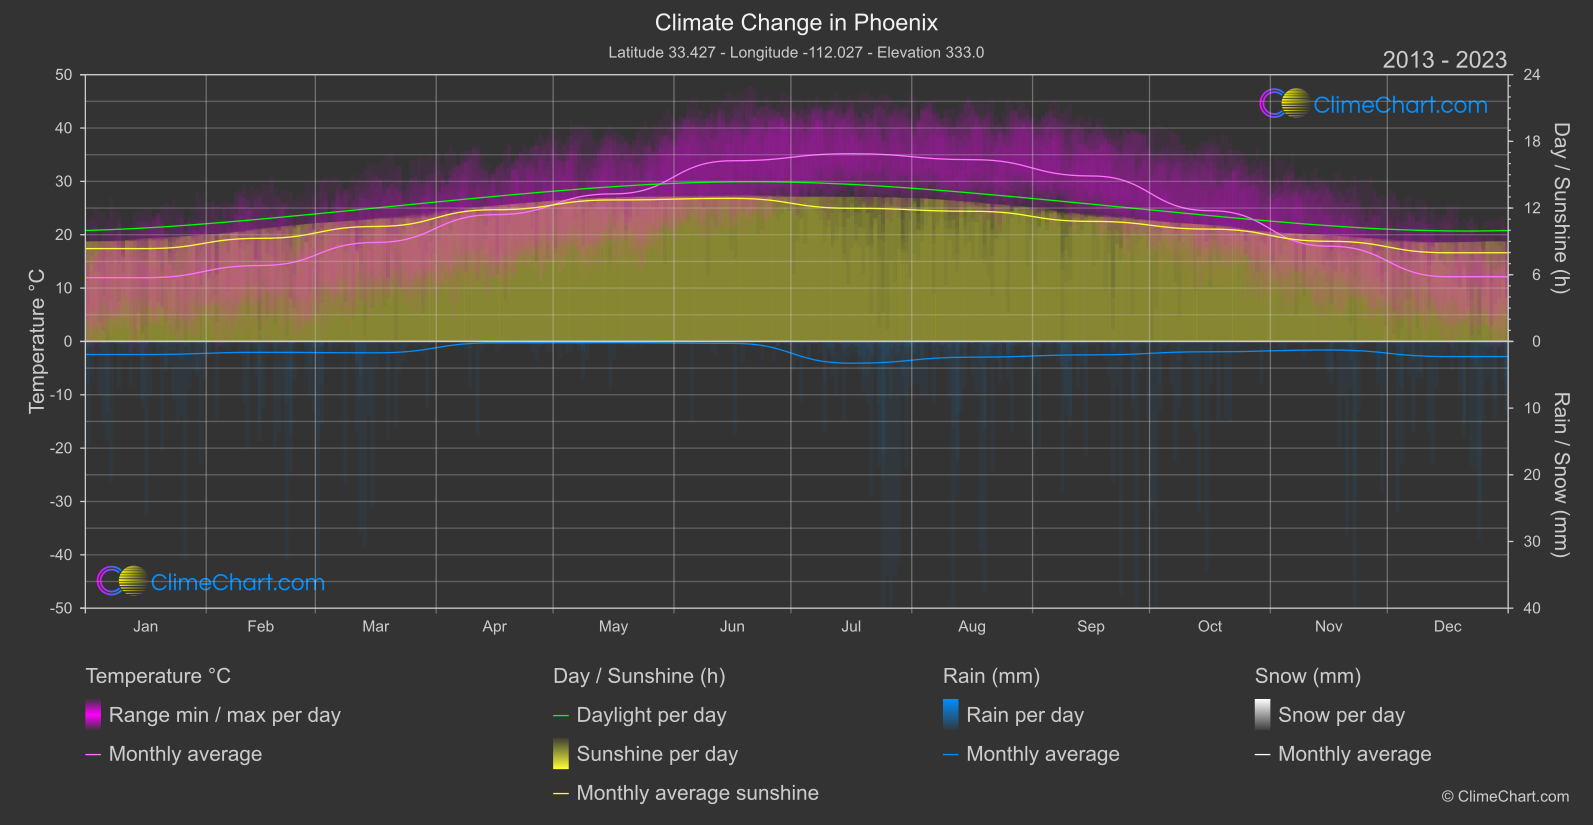
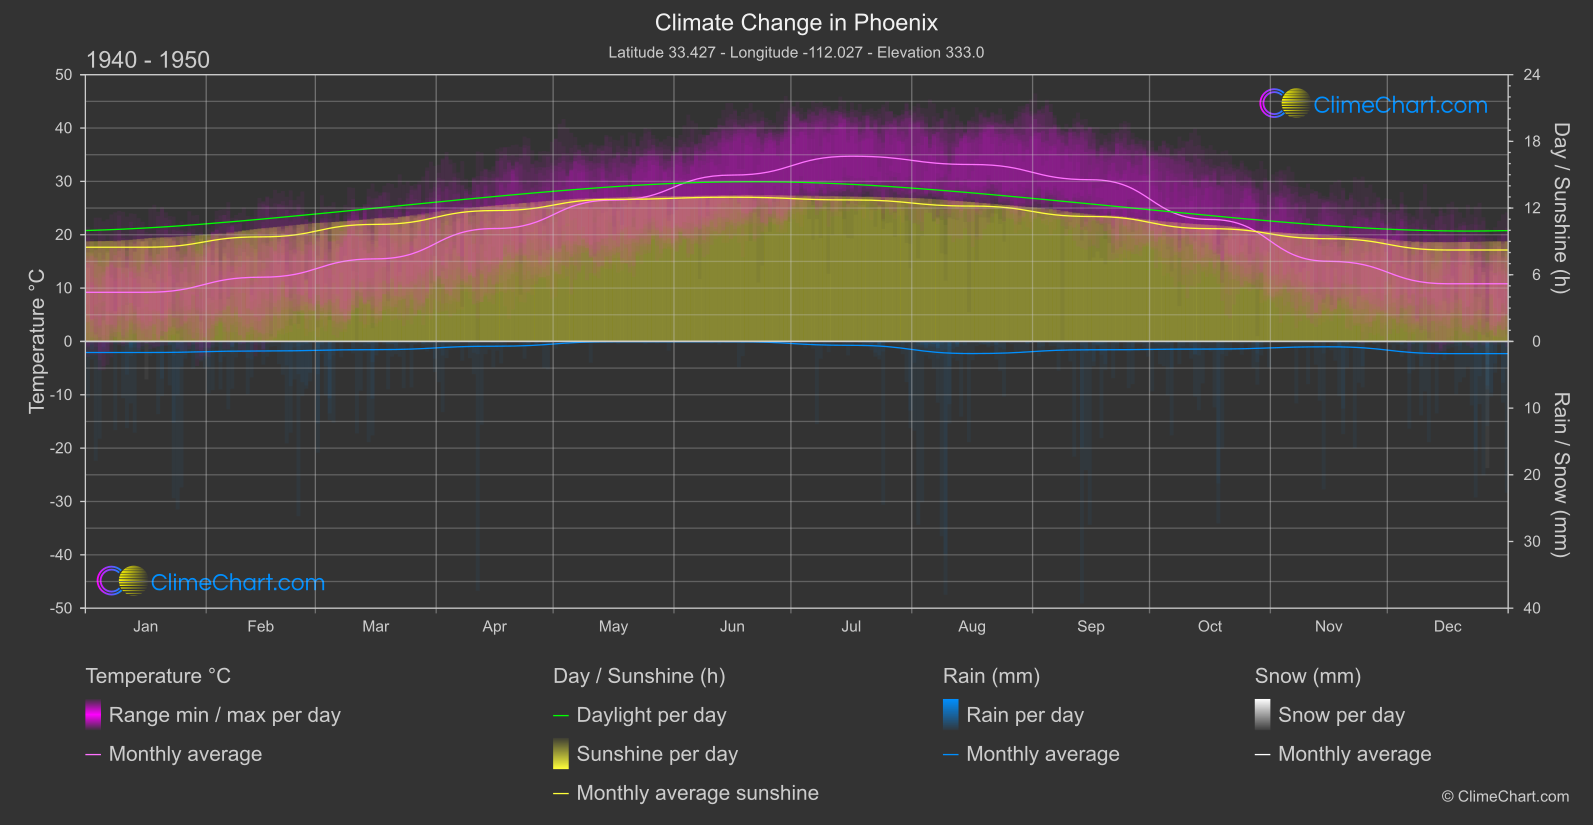
Phoenix, located in the southwestern United States, has been experiencing notable changes in its climate over the years. From temperature increases to fluctuations in rainfall and sunshine duration, the data reveals significant shifts. For instance, the month of March shows a temperature change of 3.08°C from 1940-1950 to 2013-2024. Additionally, July experienced a substantial rise in rainfall with a change of 1.34mm. Explore more insights on how the climate in Phoenix has evolved over the decades.
Climate Change Data Overview for Phoenix, USA
Explore the comprehensive climate change data for Phoenix, USA. This detailed table provides valuable insights into temperature variations, precipitation levels, and seasonal changes influenced by climate change, helping you understand the unique weather patterns of this region.
Temperature °C
| Month | ⌀ 1940 - 1950 | ⌀ 2013 - 2023 | +/- |
|---|---|---|---|
| Jan | 9.21 | 11.95 | 2.74 |
| Feb | 12.04 | 14.23 | 2.19 |
| Mar | 15.48 | 18.56 | 3.08 |
| Apr | 21.16 | 23.76 | 2.60 |
| May | 26.50 | 27.66 | 1.16 |
| Jun | 31.18 | 33.86 | 2.68 |
| Jul | 34.72 | 35.19 | 0.47 |
| Aug | 33.16 | 34.07 | 0.91 |
| Sep | 30.31 | 31.02 | 0.71 |
| Oct | 22.87 | 24.51 | 1.64 |
| Nov | 15.02 | 17.85 | 2.83 |
| Dec | 10.81 | 12.13 | 1.32 |
| ⌀ Month | 21.87 | 23.73 | 1.86 |
Sunshine (h)
| Month | ⌀ 1940 - 1950 | ⌀ 2013 - 2023 | +/- |
|---|---|---|---|
| Jan | 8.48 | 8.35 | -0.12 |
| Feb | 9.41 | 9.28 | -0.13 |
| Mar | 10.53 | 10.34 | -0.19 |
| Apr | 11.77 | 11.85 | 0.08 |
| May | 12.78 | 12.73 | -0.05 |
| Jun | 12.98 | 12.87 | -0.11 |
| Jul | 12.73 | 11.98 | -0.75 |
| Aug | 12.18 | 11.71 | -0.47 |
| Sep | 11.24 | 10.80 | -0.44 |
| Oct | 10.15 | 10.11 | -0.04 |
| Nov | 9.24 | 9.01 | -0.23 |
| Dec | 8.23 | 7.98 | -0.25 |
| ⌀ Month | 10.81 | 10.58 | -0.22 |
Rain (mm)
| Month | ⌀ 1940 - 1950 | ⌀ 2013 - 2023 | +/- |
|---|---|---|---|
| Jan | 0.83 | 0.98 | 0.15 |
| Feb | 0.72 | 0.82 | 0.10 |
| Mar | 0.62 | 0.86 | 0.24 |
| Apr | 0.36 | 0.11 | -0.25 |
| May | 0.02 | 0.09 | 0.07 |
| Jun | 0.02 | 0.14 | 0.12 |
| Jul | 0.29 | 1.63 | 1.34 |
| Aug | 0.91 | 1.18 | 0.27 |
| Sep | 0.63 | 1.01 | 0.38 |
| Oct | 0.57 | 0.77 | 0.20 |
| Nov | 0.40 | 0.64 | 0.24 |
| Dec | 0.91 | 1.13 | 0.22 |
| ⌀ Month | 0.52 | 0.78 | 0.26 |
Snow (mm)
| Month | ⌀ 1940 - 1950 | ⌀ 2013 - 2023 | +/- |
|---|---|---|---|
| Jan | 0.00 | 0.00 | -0.00 |
| Feb | 0.00 | 0.00 | 0.00 |
| Mar | 0.00 | 0.00 | 0.00 |
| Apr | 0.00 | 0.00 | 0.00 |
| May | 0.00 | 0.00 | 0.00 |
| Jun | 0.00 | 0.00 | 0.00 |
| Jul | 0.00 | 0.00 | 0.00 |
| Aug | 0.00 | 0.00 | 0.00 |
| Sep | 0.00 | 0.00 | 0.00 |
| Oct | 0.00 | 0.00 | 0.00 |
| Nov | 0.00 | 0.00 | 0.00 |
| Dec | 0.01 | 0.00 | -0.01 |
| ⌀ Month | 0.00 | 0.00 | -0.00 |