Climate Change Chart of Omsk (Sibiria), Russian Federation
Comprehensive Climate Change Chart of Omsk (Sibiria), Russian Federation: Monthly Averages and Impact Trends
Explore the climate change data for Omsk, Siberia, Russian Federation, comparing temperatures, rainfall, snowfall, and sunshine duration between 1940-1950 and 2013-2024.
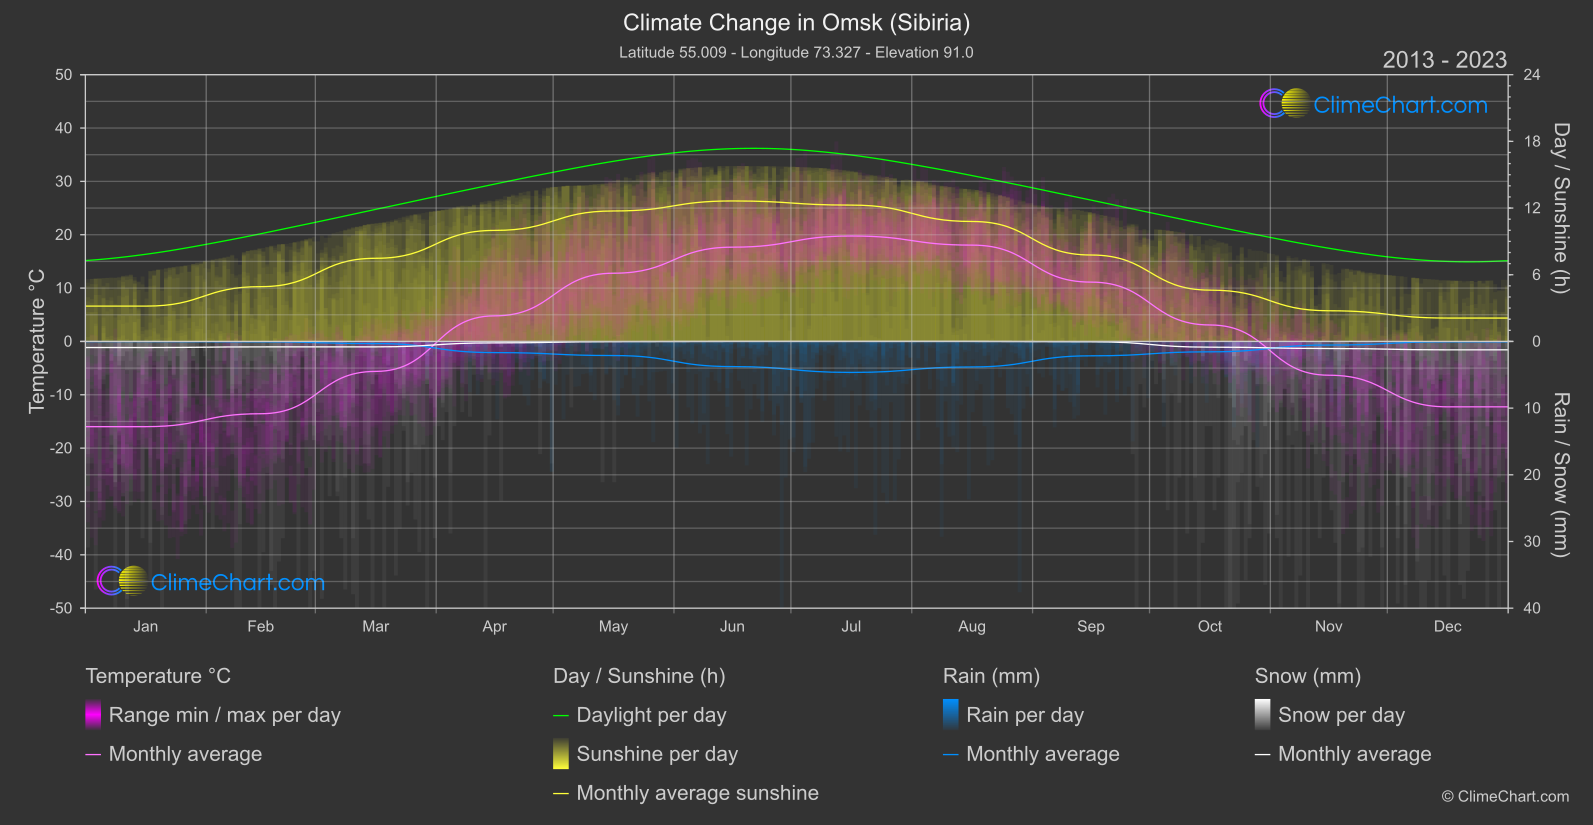
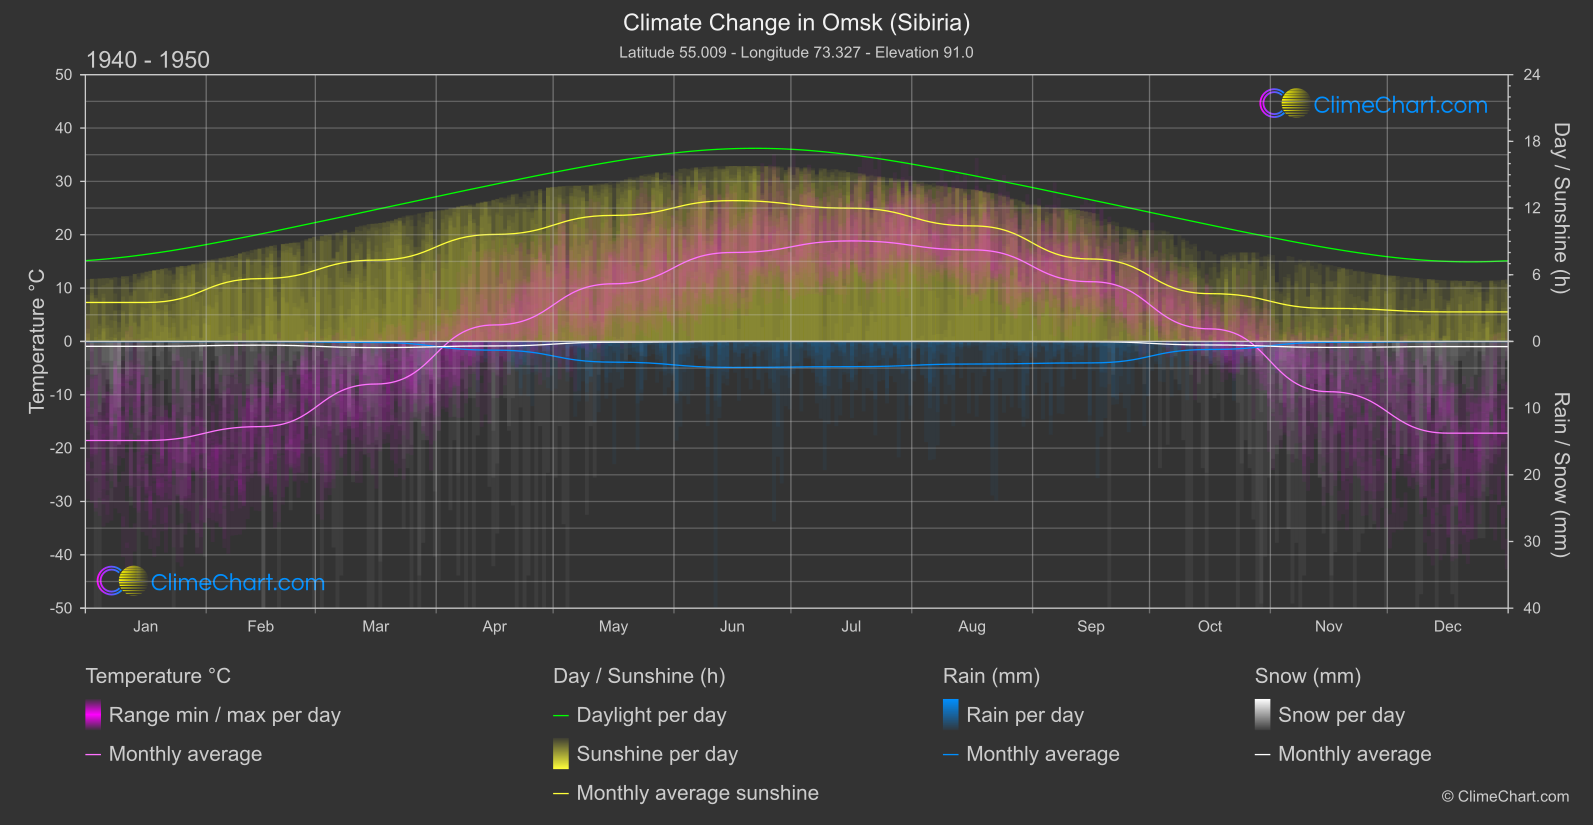
Omsk, located in Siberia, Russian Federation, has experienced significant climate changes over the years. The data shows that temperatures have generally increased, with notable changes in December showing a 4.93°C rise from 1940-1950 to 2013-2024. Rainfall patterns have also shifted, particularly in February with a 0.025mm increase. Snowfall has decreased in several months, such as April, with a -0.228mm change. Additionally, sunshine duration has varied, with a notable reduction in December by -0.554 hours.
Climate Change Data Overview for Omsk (Sibiria), Russian Federation
Explore the comprehensive climate change data for Omsk (Sibiria), Russian Federation. This detailed table provides valuable insights into temperature variations, precipitation levels, and seasonal changes influenced by climate change, helping you understand the unique weather patterns of this region.
Temperature °C
| Month | ⌀ 1940 - 1950 | ⌀ 2013 - 2023 | +/- |
|---|---|---|---|
| Jan | -18.57 | -15.97 | 2.60 |
| Feb | -15.96 | -13.55 | 2.41 |
| Mar | -7.99 | -5.62 | 2.37 |
| Apr | 3.09 | 4.80 | 1.71 |
| May | 10.81 | 12.79 | 1.98 |
| Jun | 16.67 | 17.67 | 1.00 |
| Jul | 18.84 | 19.76 | 0.92 |
| Aug | 17.17 | 18.05 | 0.89 |
| Sep | 11.20 | 11.12 | -0.08 |
| Oct | 2.36 | 3.09 | 0.73 |
| Nov | -9.42 | -6.33 | 3.09 |
| Dec | -17.19 | -12.26 | 4.93 |
| ⌀ Month | 0.92 | 2.79 | 1.88 |
Sunshine (h)
| Month | ⌀ 1940 - 1950 | ⌀ 2013 - 2023 | +/- |
|---|---|---|---|
| Jan | 3.50 | 3.18 | -0.33 |
| Feb | 5.65 | 4.93 | -0.72 |
| Mar | 7.32 | 7.48 | 0.17 |
| Apr | 9.63 | 9.99 | 0.36 |
| May | 11.34 | 11.74 | 0.40 |
| Jun | 12.67 | 12.64 | -0.03 |
| Jul | 11.99 | 12.27 | 0.28 |
| Aug | 10.40 | 10.79 | 0.40 |
| Sep | 7.42 | 7.78 | 0.36 |
| Oct | 4.30 | 4.62 | 0.32 |
| Nov | 2.98 | 2.76 | -0.22 |
| Dec | 2.66 | 2.10 | -0.55 |
| ⌀ Month | 7.49 | 7.52 | 0.04 |
Rain (mm)
| Month | ⌀ 1940 - 1950 | ⌀ 2013 - 2023 | +/- |
|---|---|---|---|
| Jan | 0.01 | 0.01 | 0.00 |
| Feb | 0.00 | 0.03 | 0.02 |
| Mar | 0.08 | 0.16 | 0.08 |
| Apr | 0.66 | 0.84 | 0.18 |
| May | 1.55 | 1.06 | -0.50 |
| Jun | 1.95 | 1.89 | -0.06 |
| Jul | 1.89 | 2.32 | 0.43 |
| Aug | 1.69 | 1.91 | 0.22 |
| Sep | 1.61 | 1.08 | -0.53 |
| Oct | 0.60 | 0.78 | 0.18 |
| Nov | 0.07 | 0.27 | 0.20 |
| Dec | 0.01 | 0.03 | 0.02 |
| ⌀ Month | 0.84 | 0.86 | 0.02 |
Snow (mm)
| Month | ⌀ 1940 - 1950 | ⌀ 2013 - 2023 | +/- |
|---|---|---|---|
| Jan | 0.37 | 0.46 | 0.09 |
| Feb | 0.28 | 0.41 | 0.13 |
| Mar | 0.46 | 0.41 | -0.06 |
| Apr | 0.34 | 0.11 | -0.23 |
| May | 0.06 | 0.02 | -0.04 |
| Jun | 0.00 | 0.00 | 0.00 |
| Jul | 0.00 | 0.00 | 0.00 |
| Aug | 0.00 | 0.00 | 0.00 |
| Sep | 0.02 | 0.03 | 0.00 |
| Oct | 0.26 | 0.43 | 0.17 |
| Nov | 0.45 | 0.53 | 0.08 |
| Dec | 0.39 | 0.63 | 0.24 |
| ⌀ Month | 0.22 | 0.25 | 0.03 |