Climate Change Chart of Méribel, France
Comprehensive Climate Change Chart of Méribel, France: Monthly Averages and Impact Trends
Explore the changing climate in Méribel, France, with insightful data comparisons from different time periods.
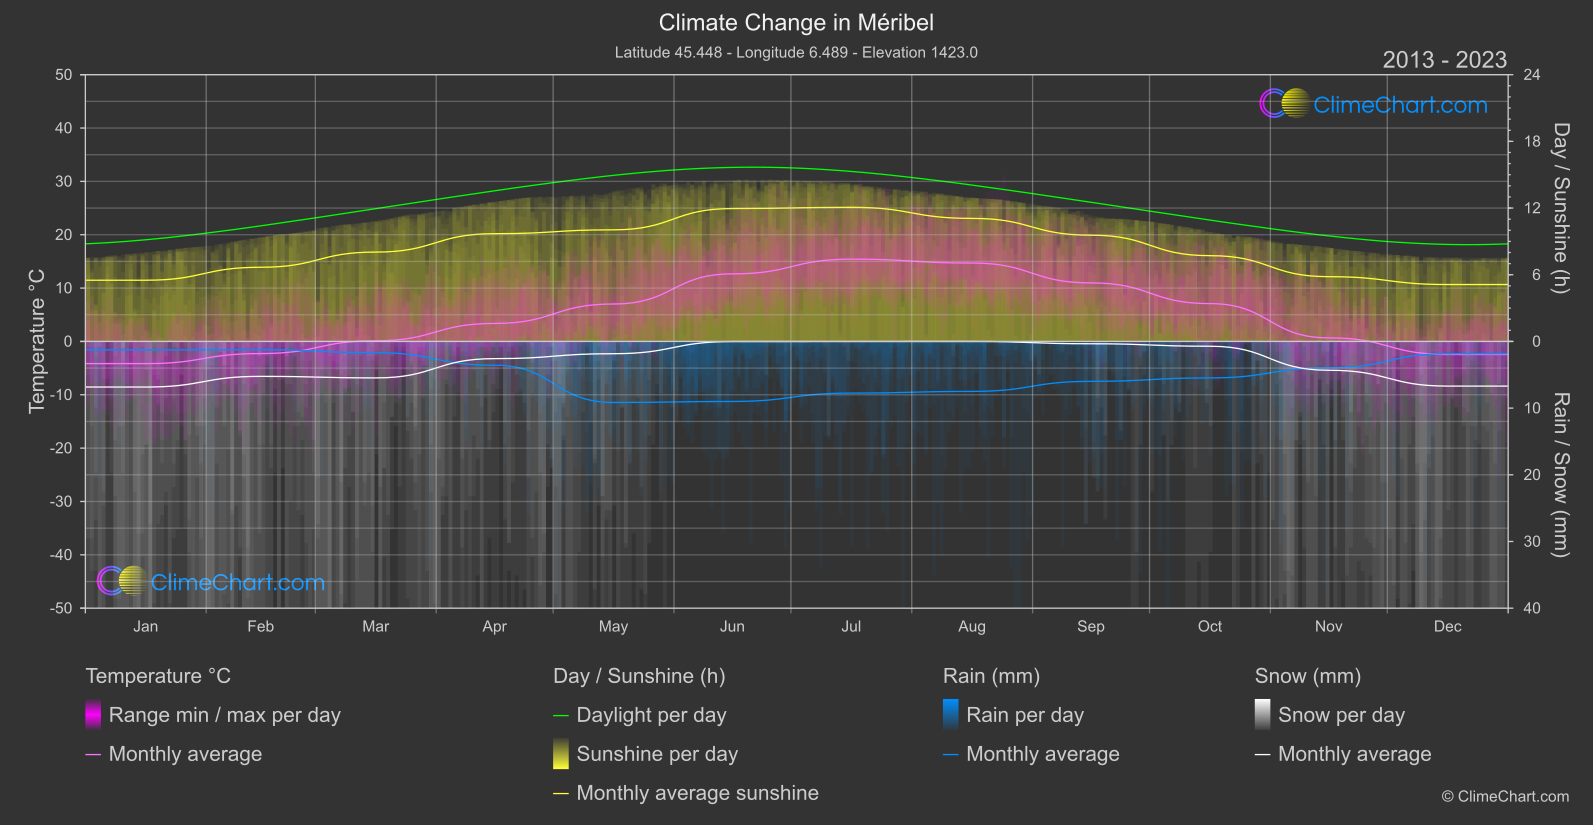
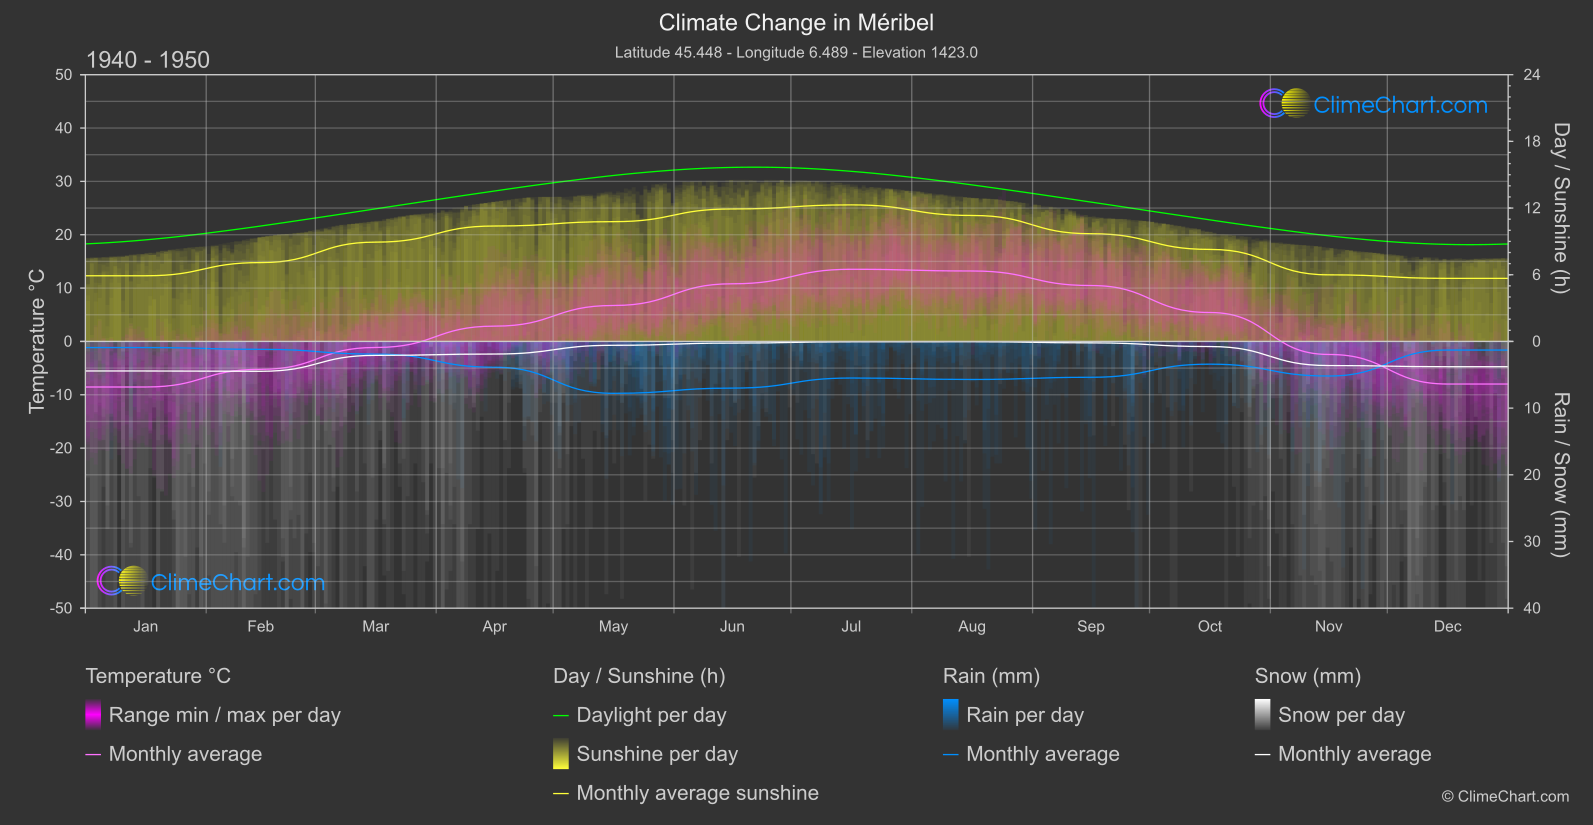
Get detailed insights into the climate and weather changes in Méribel, France, with comparisons of temperature, rainfall, snowfall, and sunshine duration between the periods of 1940-1950 and 2013-2024. Discover which months experienced the highest changes in temperature or precipitation, providing valuable information for understanding the evolving climate patterns in this region.
Climate Change Data Overview for Méribel, France
Explore the comprehensive climate change data for Méribel, France. This detailed table provides valuable insights into temperature variations, precipitation levels, and seasonal changes influenced by climate change, helping you understand the unique weather patterns of this region.
Temperature °C
| Month | ⌀ 1940 - 1950 | ⌀ 2013 - 2023 | +/- |
|---|---|---|---|
| Jan | -8.54 | -4.16 | 4.38 |
| Feb | -5.23 | -2.28 | 2.95 |
| Mar | -1.13 | 0.12 | 1.25 |
| Apr | 2.87 | 3.37 | 0.51 |
| May | 6.74 | 7.02 | 0.28 |
| Jun | 10.81 | 12.66 | 1.86 |
| Jul | 13.52 | 15.42 | 1.90 |
| Aug | 13.20 | 14.69 | 1.49 |
| Sep | 10.48 | 10.97 | 0.49 |
| Oct | 5.42 | 7.09 | 1.67 |
| Nov | -2.44 | 0.67 | 3.12 |
| Dec | -7.99 | -2.45 | 5.54 |
| ⌀ Month | 3.14 | 5.26 | 2.12 |
Sunshine (h)
| Month | ⌀ 1940 - 1950 | ⌀ 2013 - 2023 | +/- |
|---|---|---|---|
| Jan | 5.91 | 5.51 | -0.40 |
| Feb | 7.09 | 6.67 | -0.42 |
| Mar | 8.93 | 8.04 | -0.90 |
| Apr | 10.38 | 9.69 | -0.69 |
| May | 10.78 | 10.04 | -0.74 |
| Jun | 11.92 | 11.96 | 0.04 |
| Jul | 12.29 | 12.07 | -0.22 |
| Aug | 11.33 | 11.07 | -0.26 |
| Sep | 9.69 | 9.56 | -0.13 |
| Oct | 8.28 | 7.72 | -0.56 |
| Nov | 5.99 | 5.83 | -0.17 |
| Dec | 5.67 | 5.12 | -0.56 |
| ⌀ Month | 9.02 | 8.61 | -0.42 |
Rain (mm)
| Month | ⌀ 1940 - 1950 | ⌀ 2013 - 2023 | +/- |
|---|---|---|---|
| Jan | 0.46 | 0.63 | 0.17 |
| Feb | 0.59 | 0.62 | 0.03 |
| Mar | 0.95 | 0.84 | -0.11 |
| Apr | 1.94 | 1.79 | -0.15 |
| May | 3.89 | 4.58 | 0.69 |
| Jun | 3.50 | 4.50 | 1.00 |
| Jul | 2.74 | 3.87 | 1.13 |
| Aug | 2.85 | 3.75 | 0.89 |
| Sep | 2.69 | 2.99 | 0.30 |
| Oct | 1.70 | 2.73 | 1.03 |
| Nov | 2.59 | 1.99 | -0.61 |
| Dec | 0.65 | 0.92 | 0.28 |
| ⌀ Month | 2.05 | 2.43 | 0.39 |
Snow (mm)
| Month | ⌀ 1940 - 1950 | ⌀ 2013 - 2023 | +/- |
|---|---|---|---|
| Jan | 2.22 | 3.42 | 1.20 |
| Feb | 2.24 | 2.62 | 0.38 |
| Mar | 1.04 | 2.73 | 1.69 |
| Apr | 0.95 | 1.29 | 0.34 |
| May | 0.29 | 0.92 | 0.63 |
| Jun | 0.12 | 0.01 | -0.12 |
| Jul | 0.03 | 0.01 | -0.02 |
| Aug | 0.02 | 0.00 | -0.02 |
| Sep | 0.11 | 0.17 | 0.07 |
| Oct | 0.38 | 0.36 | -0.02 |
| Nov | 1.81 | 2.16 | 0.35 |
| Dec | 1.90 | 3.35 | 1.45 |
| ⌀ Month | 0.92 | 1.42 | 0.50 |