Climate Change Chart of Martha's Vineyard, USA
Comprehensive Climate Change Chart of Martha's Vineyard, USA: Monthly Averages and Impact Trends
Exploring the changing climate in Martha's Vineyard, USA reveals intriguing insights into temperature, rainfall, snowfall, and sunshine duration trends over the years.
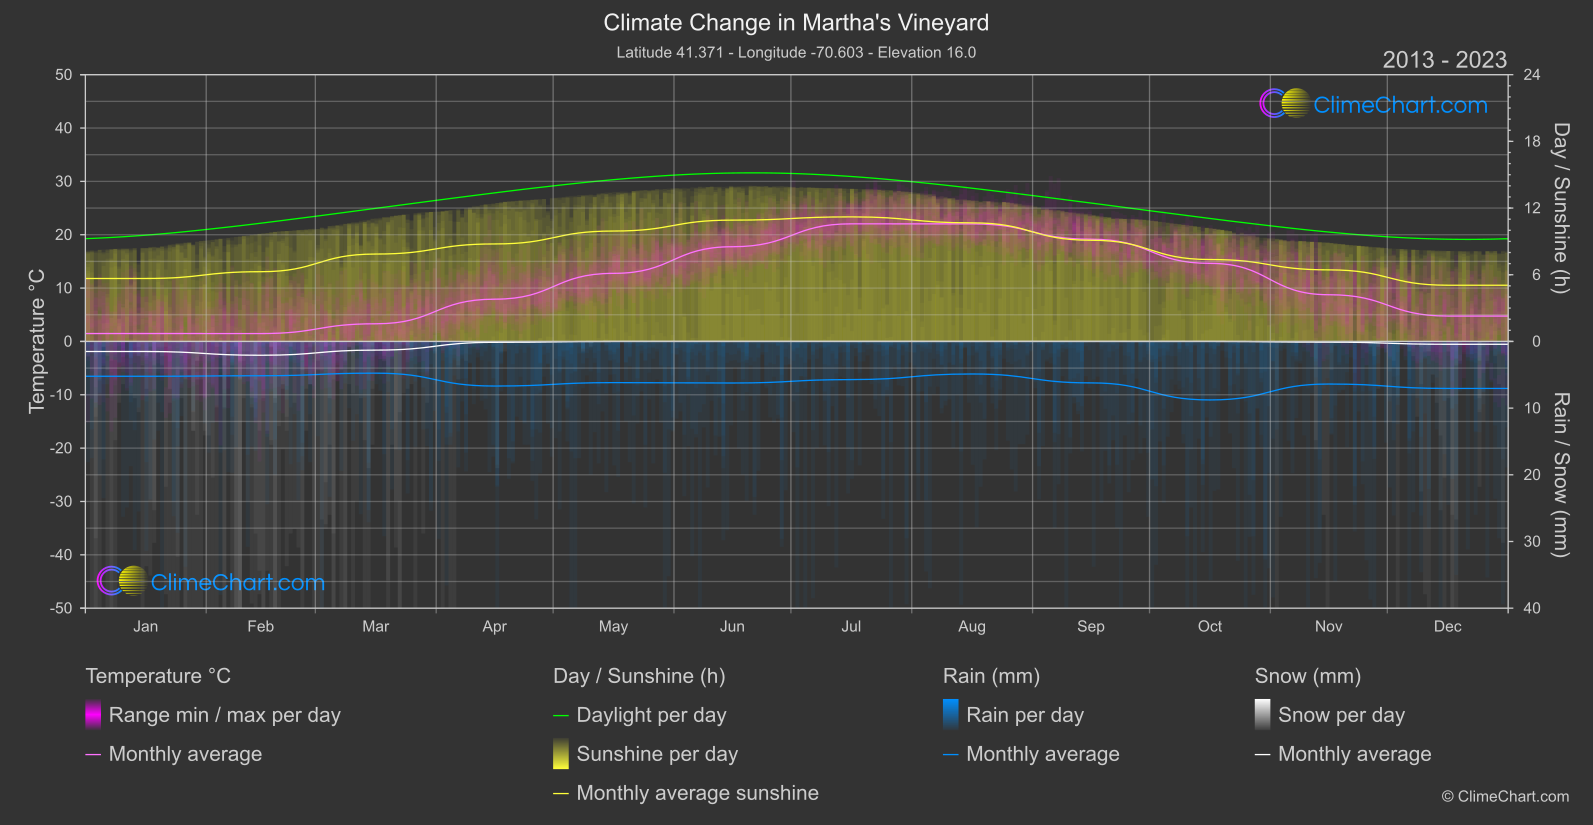
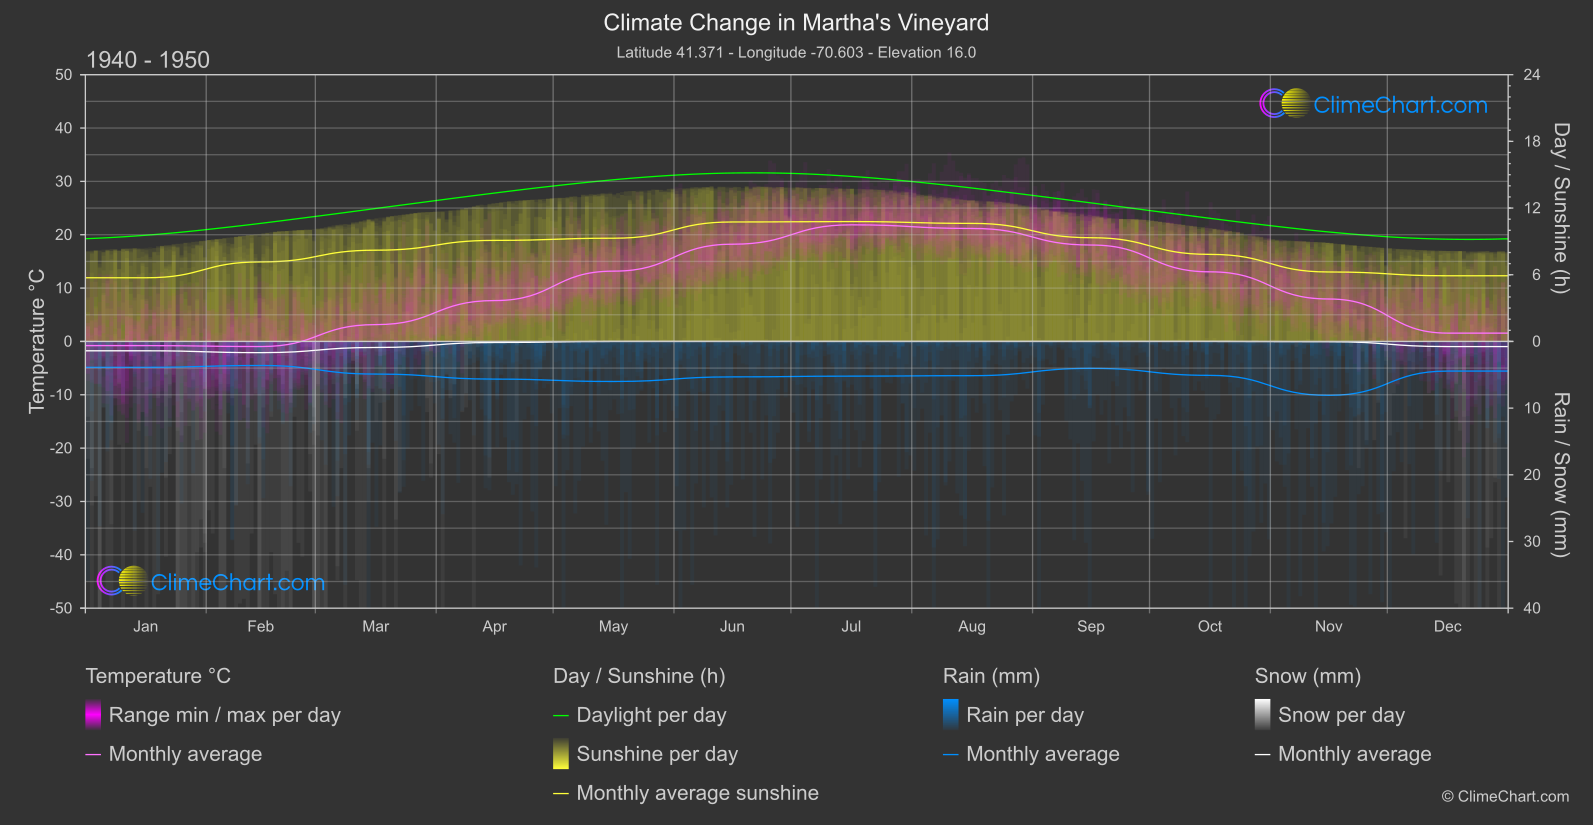
Martha's Vineyard, located in the United States, has witnessed significant changes in its climate over the years. Analyzing the data reveals that the month of December experienced the highest temperature change from 1940-1950 to 2013-2024, with a remarkable increase of 3.20°C. Additionally, comparing rainfall data shows that October saw the biggest increase in rainfall, with a rise of 1.84mm. Snowfall remained relatively stable over the years, with minimal changes observed. Sunshine duration showed varying trends, with May experiencing the highest increase in sunlight hours. These insights highlight the ongoing impact of climate change on Martha's Vineyard.
Climate Change Data Overview for Martha's Vineyard, USA
Explore the comprehensive climate change data for Martha's Vineyard, USA. This detailed table provides valuable insights into temperature variations, precipitation levels, and seasonal changes influenced by climate change, helping you understand the unique weather patterns of this region.
Temperature °C
| Month | ⌀ 1940 - 1950 | ⌀ 2013 - 2023 | +/- |
|---|---|---|---|
| Jan | -0.78 | 1.48 | 2.26 |
| Feb | -0.96 | 1.47 | 2.43 |
| Mar | 3.15 | 3.31 | 0.16 |
| Apr | 7.66 | 7.92 | 0.26 |
| May | 13.18 | 12.76 | -0.41 |
| Jun | 18.22 | 17.75 | -0.47 |
| Jul | 21.85 | 22.04 | 0.19 |
| Aug | 21.18 | 22.03 | 0.86 |
| Sep | 18.07 | 19.16 | 1.09 |
| Oct | 13.05 | 14.63 | 1.59 |
| Nov | 7.95 | 8.75 | 0.80 |
| Dec | 1.56 | 4.76 | 3.20 |
| ⌀ Month | 10.34 | 11.34 | 1.00 |
Sunshine (h)
| Month | ⌀ 1940 - 1950 | ⌀ 2013 - 2023 | +/- |
|---|---|---|---|
| Jan | 5.73 | 5.66 | -0.06 |
| Feb | 7.16 | 6.27 | -0.88 |
| Mar | 8.21 | 7.86 | -0.35 |
| Apr | 9.09 | 8.77 | -0.32 |
| May | 9.29 | 9.93 | 0.65 |
| Jun | 10.75 | 10.91 | 0.17 |
| Jul | 10.78 | 11.21 | 0.42 |
| Aug | 10.62 | 10.67 | 0.05 |
| Sep | 9.33 | 9.10 | -0.23 |
| Oct | 7.83 | 7.37 | -0.46 |
| Nov | 6.25 | 6.44 | 0.19 |
| Dec | 5.91 | 5.06 | -0.85 |
| ⌀ Month | 8.41 | 8.27 | -0.14 |
Rain (mm)
| Month | ⌀ 1940 - 1950 | ⌀ 2013 - 2023 | +/- |
|---|---|---|---|
| Jan | 1.94 | 2.61 | 0.67 |
| Feb | 1.80 | 2.57 | 0.77 |
| Mar | 2.45 | 2.38 | -0.07 |
| Apr | 2.83 | 3.34 | 0.52 |
| May | 3.00 | 3.09 | 0.09 |
| Jun | 2.66 | 3.12 | 0.46 |
| Jul | 2.60 | 2.86 | 0.26 |
| Aug | 2.57 | 2.44 | -0.13 |
| Sep | 2.02 | 3.11 | 1.09 |
| Oct | 2.54 | 4.39 | 1.84 |
| Nov | 4.04 | 3.19 | -0.85 |
| Dec | 2.22 | 3.52 | 1.30 |
| ⌀ Month | 2.56 | 3.05 | 0.50 |
Snow (mm)
| Month | ⌀ 1940 - 1950 | ⌀ 2013 - 2023 | +/- |
|---|---|---|---|
| Jan | 0.70 | 0.76 | 0.05 |
| Feb | 0.84 | 1.04 | 0.20 |
| Mar | 0.45 | 0.65 | 0.20 |
| Apr | 0.08 | 0.07 | -0.01 |
| May | 0.00 | 0.00 | 0.00 |
| Jun | 0.00 | 0.00 | 0.00 |
| Jul | 0.00 | 0.00 | 0.00 |
| Aug | 0.00 | 0.00 | 0.00 |
| Sep | 0.00 | 0.00 | 0.00 |
| Oct | 0.00 | 0.00 | 0.00 |
| Nov | 0.02 | 0.05 | 0.03 |
| Dec | 0.38 | 0.21 | -0.17 |
| ⌀ Month | 0.21 | 0.23 | 0.02 |