Climate Change Chart of Manchester, Great Britain
Comprehensive Climate Change Chart of Manchester, Great Britain: Monthly Averages and Impact Trends
Exploring the changing climate patterns in Manchester, UK reveals intriguing insights into temperature, rainfall, snowfall, and sunshine duration fluctuations.
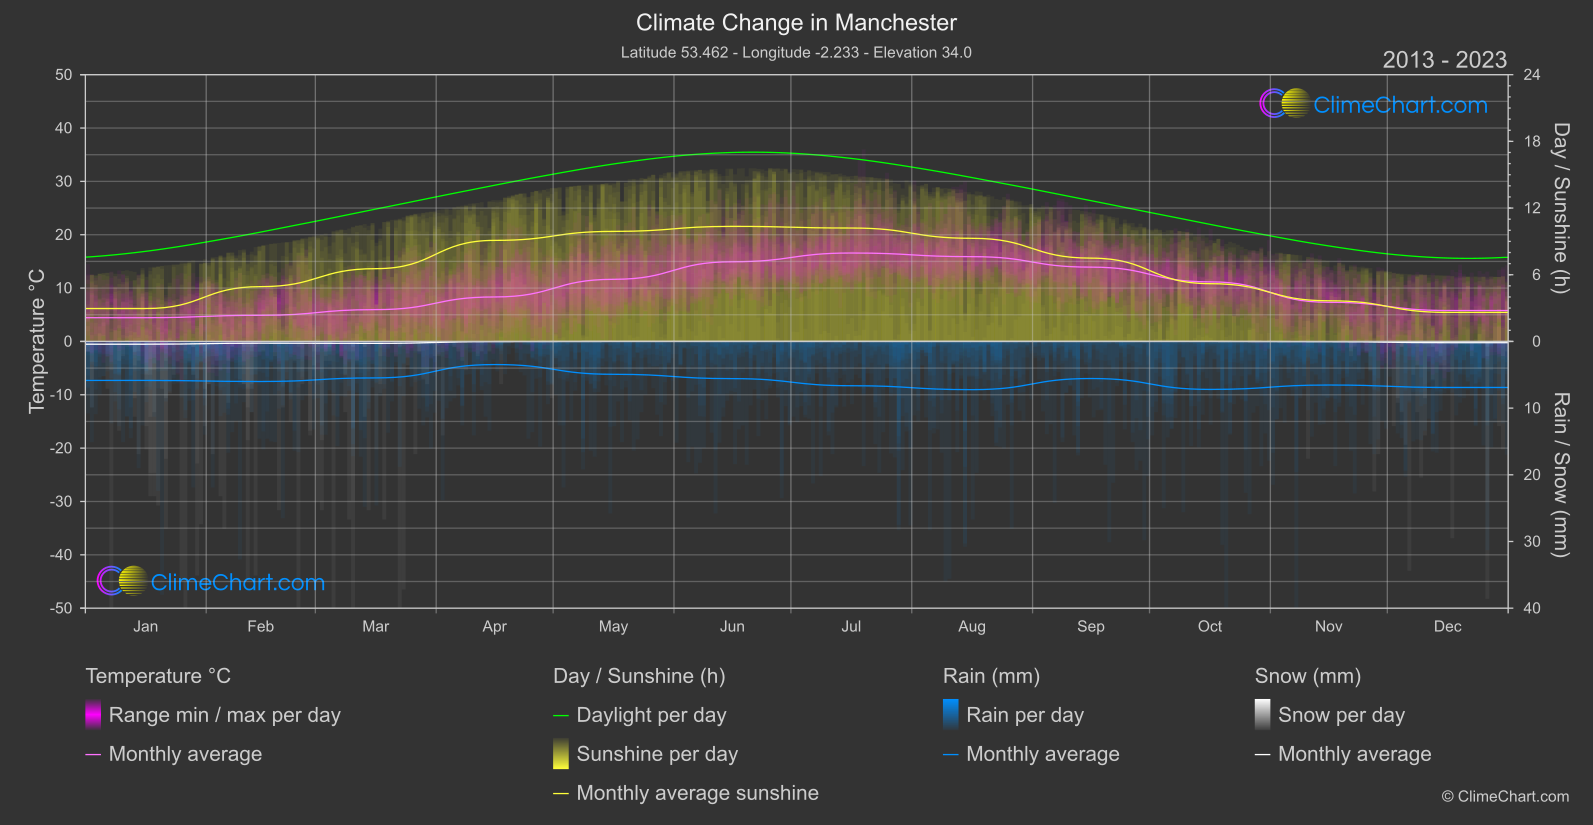
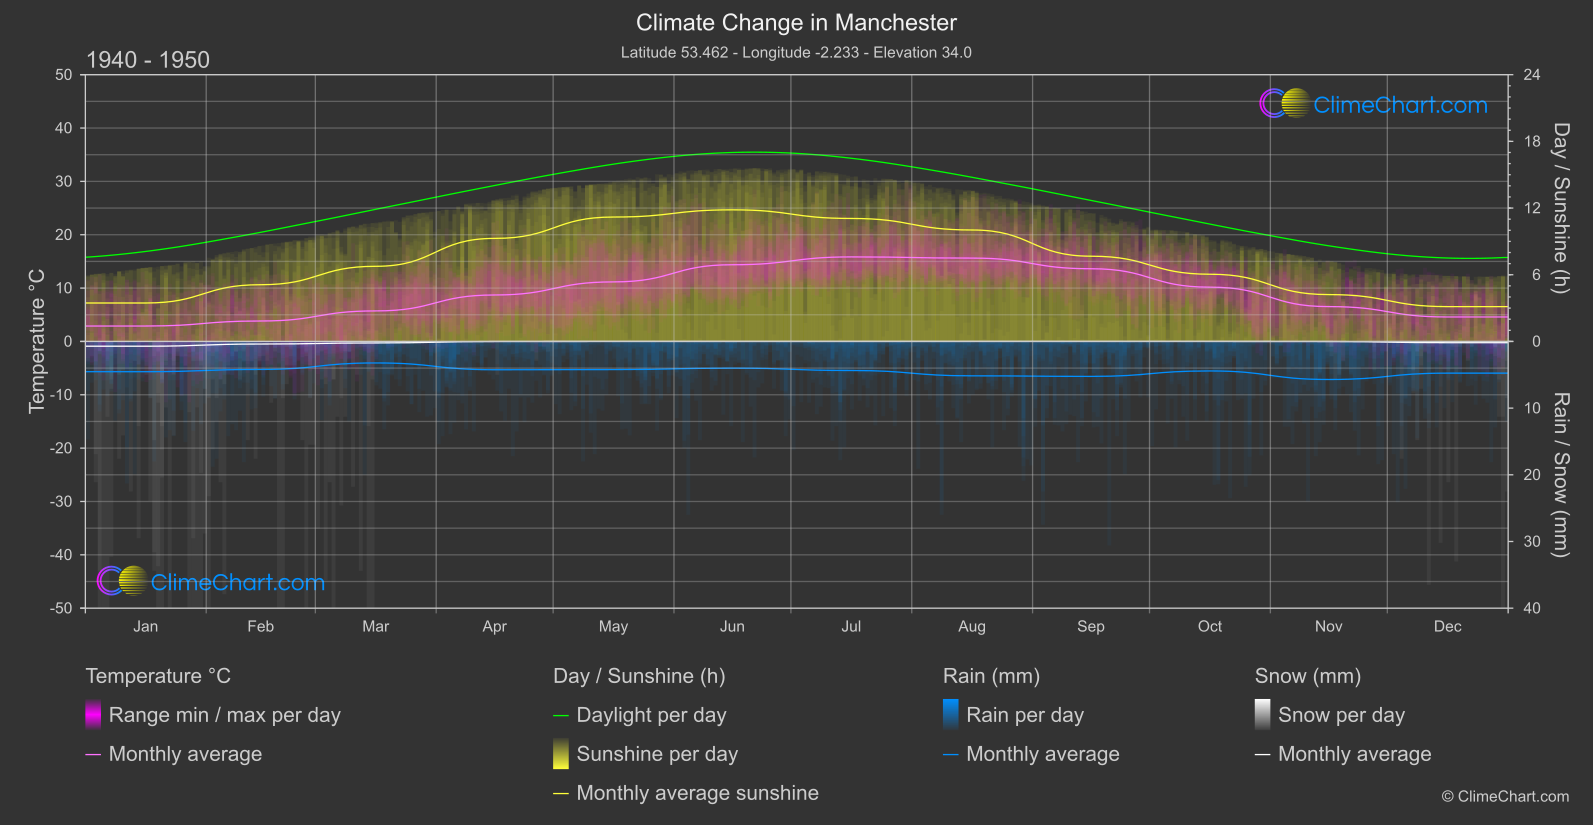
Manchester, located in the United Kingdom, has experienced notable changes in its climate over the years. From 1940 to 1950 compared to 2013 to 2024, we observe shifts in temperature, rainfall, snowfall, and sunshine duration. For instance, the data highlights a significant increase in temperatures across most months, with December showing the highest temperature change of 1.21°C. In terms of rainfall, the month of October witnessed the most significant increase in precipitation, with a change of 1.38 mm. Snowfall remained relatively stable over the years, with minimal variations. Sunshine duration, however, displayed a decreasing trend, with May experiencing the most substantial decline of 1.29 hours of sunshine.
Climate Change Data Overview for Manchester, Great Britain
Explore the comprehensive climate change data for Manchester, Great Britain. This detailed table provides valuable insights into temperature variations, precipitation levels, and seasonal changes influenced by climate change, helping you understand the unique weather patterns of this region.
Temperature °C
| Month | ⌀ 1940 - 1950 | ⌀ 2013 - 2023 | +/- |
|---|---|---|---|
| Jan | 2.89 | 4.45 | 1.56 |
| Feb | 3.83 | 4.90 | 1.07 |
| Mar | 5.72 | 5.96 | 0.24 |
| Apr | 8.71 | 8.34 | -0.37 |
| May | 11.16 | 11.64 | 0.48 |
| Jun | 14.37 | 14.94 | 0.56 |
| Jul | 15.84 | 16.57 | 0.73 |
| Aug | 15.62 | 15.89 | 0.27 |
| Sep | 13.62 | 13.93 | 0.30 |
| Oct | 10.17 | 11.17 | 0.99 |
| Nov | 6.53 | 7.33 | 0.81 |
| Dec | 4.58 | 5.80 | 1.21 |
| ⌀ Month | 9.42 | 10.08 | 0.65 |
Sunshine (h)
| Month | ⌀ 1940 - 1950 | ⌀ 2013 - 2023 | +/- |
|---|---|---|---|
| Jan | 3.46 | 2.96 | -0.50 |
| Feb | 5.10 | 4.93 | -0.17 |
| Mar | 6.76 | 6.55 | -0.21 |
| Apr | 9.27 | 9.09 | -0.18 |
| May | 11.19 | 9.90 | -1.29 |
| Jun | 11.84 | 10.35 | -1.49 |
| Jul | 11.06 | 10.20 | -0.86 |
| Aug | 10.03 | 9.28 | -0.75 |
| Sep | 7.67 | 7.50 | -0.17 |
| Oct | 6.05 | 5.20 | -0.85 |
| Nov | 4.21 | 3.66 | -0.56 |
| Dec | 3.13 | 2.61 | -0.52 |
| ⌀ Month | 7.48 | 6.85 | -0.63 |
Rain (mm)
| Month | ⌀ 1940 - 1950 | ⌀ 2013 - 2023 | +/- |
|---|---|---|---|
| Jan | 2.27 | 2.92 | 0.65 |
| Feb | 2.10 | 3.00 | 0.91 |
| Mar | 1.61 | 2.73 | 1.12 |
| Apr | 2.12 | 1.73 | -0.39 |
| May | 2.11 | 2.46 | 0.35 |
| Jun | 2.00 | 2.79 | 0.79 |
| Jul | 2.18 | 3.32 | 1.14 |
| Aug | 2.58 | 3.61 | 1.04 |
| Sep | 2.62 | 2.78 | 0.16 |
| Oct | 2.21 | 3.60 | 1.38 |
| Nov | 2.85 | 3.27 | 0.42 |
| Dec | 2.38 | 3.45 | 1.07 |
| ⌀ Month | 2.25 | 2.97 | 0.72 |
Snow (mm)
| Month | ⌀ 1940 - 1950 | ⌀ 2013 - 2023 | +/- |
|---|---|---|---|
| Jan | 0.36 | 0.21 | -0.15 |
| Feb | 0.19 | 0.13 | -0.06 |
| Mar | 0.11 | 0.14 | 0.03 |
| Apr | 0.01 | 0.01 | 0.01 |
| May | 0.00 | 0.00 | 0.00 |
| Jun | 0.00 | 0.00 | 0.00 |
| Jul | 0.00 | 0.00 | 0.00 |
| Aug | 0.00 | 0.00 | 0.00 |
| Sep | 0.00 | 0.00 | 0.00 |
| Oct | 0.00 | 0.00 | 0.00 |
| Nov | 0.01 | 0.02 | 0.01 |
| Dec | 0.09 | 0.09 | 0.00 |
| ⌀ Month | 0.06 | 0.05 | -0.01 |