Climate Change Chart of Majorca, Spain
Comprehensive Climate Change Chart of Majorca, Spain: Monthly Averages and Impact Trends
Exploring the changing climate in Majorca, Spain reveals intriguing insights into temperature, rainfall, snowfall, and sunshine duration over the years. Dive into the data to understand the impact of climate change on this beautiful island.
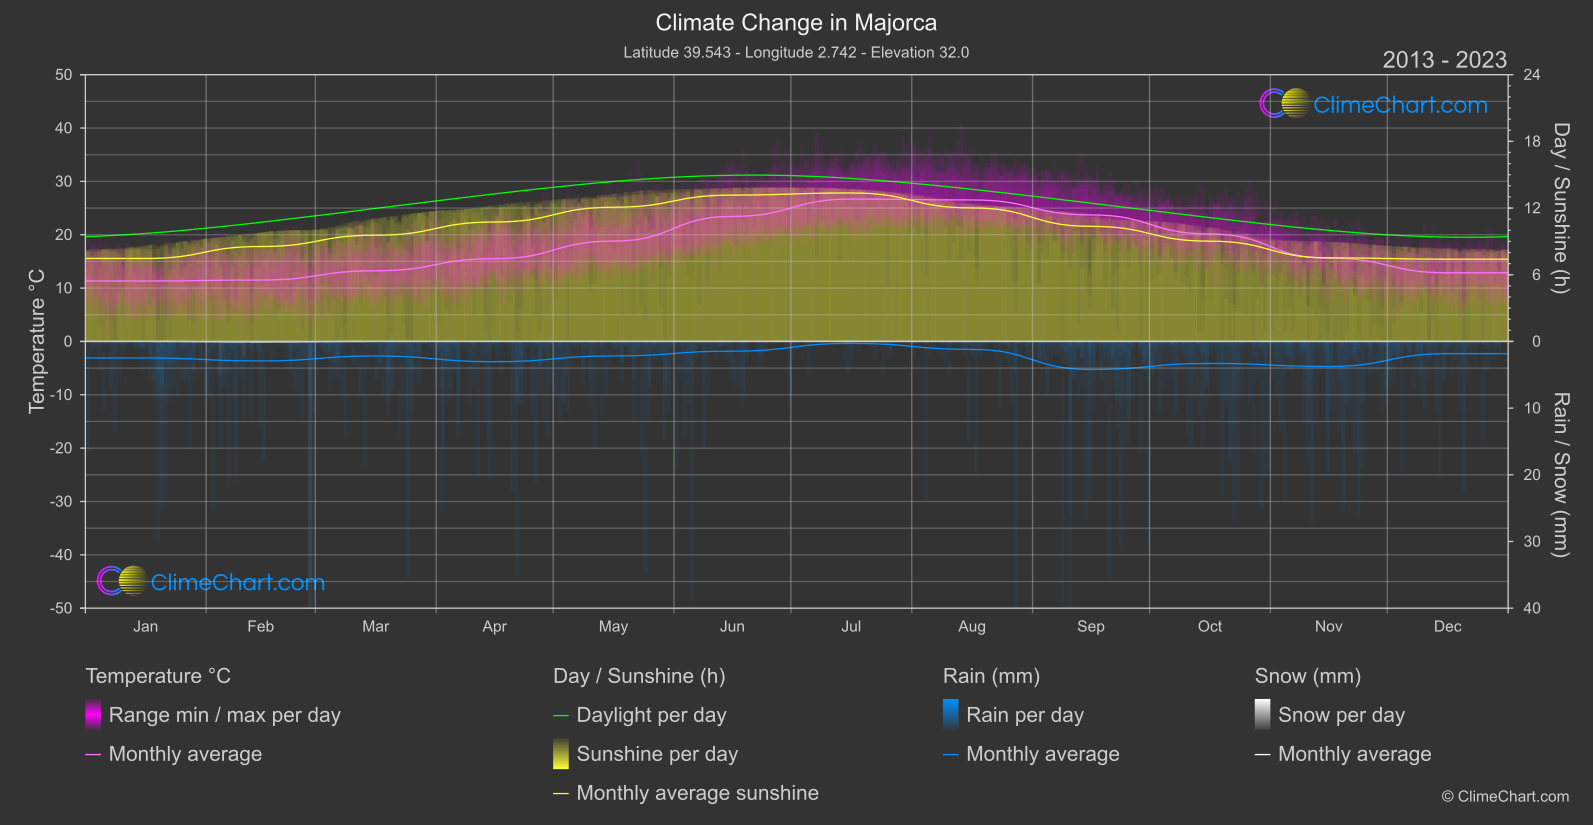
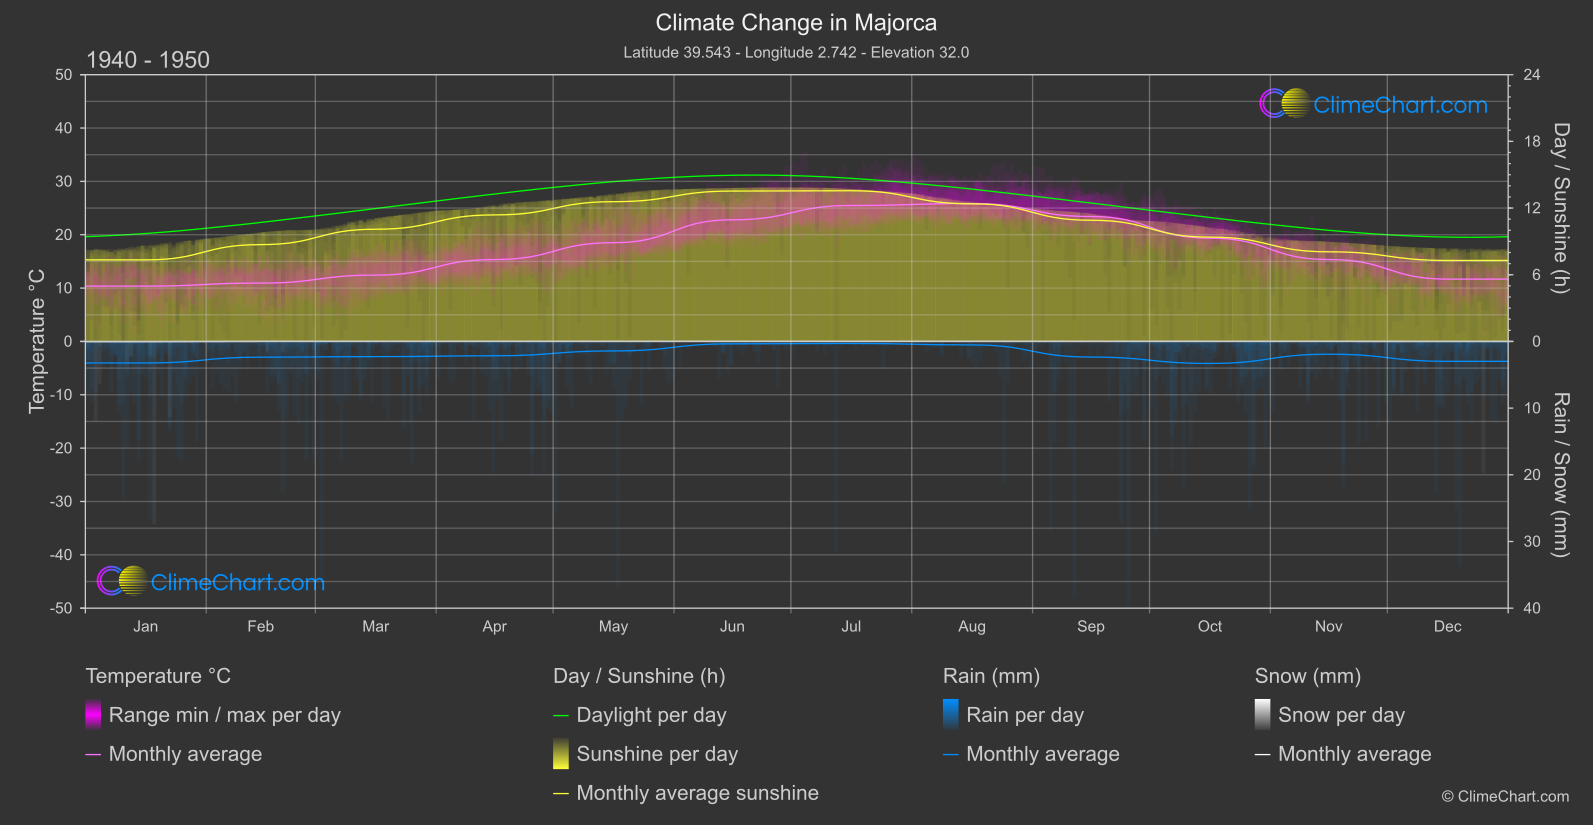
Majorca, a popular destination known for its stunning landscapes and Mediterranean climate, has been experiencing noticeable changes in its climate over the years. Analyzing the temperature data from 1940 to 1950 compared to 2013 to 2024, it is evident that the months of December and July have shown the highest temperature changes, with an increase of 1.186°C and 1.209°C respectively. On the other hand, when it comes to rainfall, September stands out as the month with the most significant change, experiencing an increase of 0.931 mm. Snowfall data indicates minimal to no change over the years. However, the sunshine duration has decreased notably, with March showing the highest decrease of 0.538 hours compared to the same period in the past.
Climate Change Data Overview for Majorca, Spain
Explore the comprehensive climate change data for Majorca, Spain. This detailed table provides valuable insights into temperature variations, precipitation levels, and seasonal changes influenced by climate change, helping you understand the unique weather patterns of this region.
Temperature °C
| Month | ⌀ 1940 - 1950 | ⌀ 2013 - 2023 | +/- |
|---|---|---|---|
| Jan | 10.37 | 11.32 | 0.95 |
| Feb | 10.94 | 11.52 | 0.58 |
| Mar | 12.43 | 13.25 | 0.82 |
| Apr | 15.35 | 15.51 | 0.17 |
| May | 18.51 | 18.81 | 0.30 |
| Jun | 22.80 | 23.43 | 0.63 |
| Jul | 25.48 | 26.69 | 1.21 |
| Aug | 25.85 | 26.52 | 0.67 |
| Sep | 23.42 | 23.72 | 0.30 |
| Oct | 19.36 | 20.14 | 0.77 |
| Nov | 15.35 | 15.60 | 0.25 |
| Dec | 11.68 | 12.86 | 1.19 |
| ⌀ Month | 17.63 | 18.28 | 0.65 |
Sunshine (h)
| Month | ⌀ 1940 - 1950 | ⌀ 2013 - 2023 | +/- |
|---|---|---|---|
| Jan | 7.34 | 7.46 | 0.13 |
| Feb | 8.71 | 8.54 | -0.17 |
| Mar | 10.10 | 9.56 | -0.54 |
| Apr | 11.38 | 10.74 | -0.64 |
| May | 12.57 | 12.07 | -0.50 |
| Jun | 13.53 | 13.17 | -0.36 |
| Jul | 13.56 | 13.36 | -0.20 |
| Aug | 12.38 | 12.01 | -0.37 |
| Sep | 10.90 | 10.35 | -0.55 |
| Oct | 9.39 | 9.02 | -0.37 |
| Nov | 8.06 | 7.52 | -0.54 |
| Dec | 7.28 | 7.40 | 0.12 |
| ⌀ Month | 10.43 | 10.10 | -0.33 |
Rain (mm)
| Month | ⌀ 1940 - 1950 | ⌀ 2013 - 2023 | +/- |
|---|---|---|---|
| Jan | 1.62 | 1.24 | -0.38 |
| Feb | 1.18 | 1.46 | 0.29 |
| Mar | 1.14 | 1.09 | -0.05 |
| Apr | 1.08 | 1.52 | 0.45 |
| May | 0.71 | 1.09 | 0.38 |
| Jun | 0.18 | 0.73 | 0.55 |
| Jul | 0.15 | 0.15 | -0.01 |
| Aug | 0.26 | 0.60 | 0.34 |
| Sep | 1.17 | 2.10 | 0.93 |
| Oct | 1.65 | 1.65 | -0.00 |
| Nov | 0.96 | 1.88 | 0.92 |
| Dec | 1.49 | 0.92 | -0.57 |
| ⌀ Month | 0.97 | 1.20 | 0.24 |
Snow (mm)
| Month | ⌀ 1940 - 1950 | ⌀ 2013 - 2023 | +/- |
|---|---|---|---|
| Jan | 0.02 | 0.00 | -0.02 |
| Feb | 0.00 | 0.03 | 0.03 |
| Mar | 0.00 | 0.00 | 0.00 |
| Apr | 0.00 | 0.00 | 0.00 |
| May | 0.00 | 0.00 | 0.00 |
| Jun | 0.00 | 0.00 | 0.00 |
| Jul | 0.00 | 0.00 | 0.00 |
| Aug | 0.00 | 0.00 | 0.00 |
| Sep | 0.00 | 0.00 | 0.00 |
| Oct | 0.00 | 0.00 | 0.00 |
| Nov | 0.00 | 0.00 | 0.00 |
| Dec | 0.01 | 0.00 | -0.01 |
| ⌀ Month | 0.00 | 0.00 | 0.00 |