Climate Change Chart of Les Arcs (Savoie), France
Comprehensive Climate Change Chart of Les Arcs (Savoie), France: Monthly Averages and Impact Trends
Explore the changing climate in Les Arcs (Savoie), France with data insights on temperature, rainfall, snowfall, and sunshine duration. Discover how the climate has evolved from 1940 to 1950 compared to 2013 to 2024.
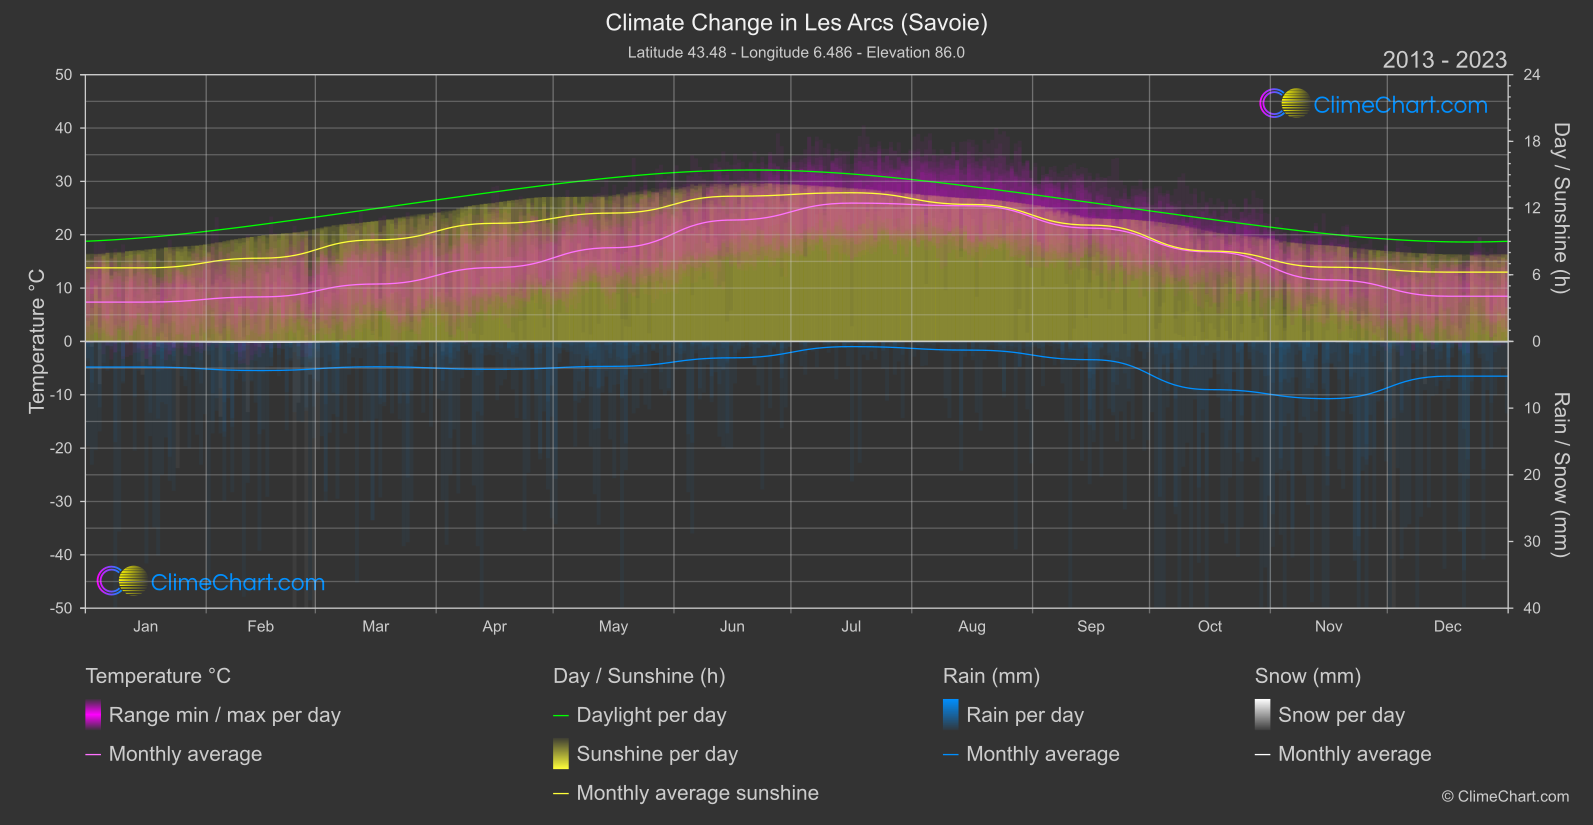
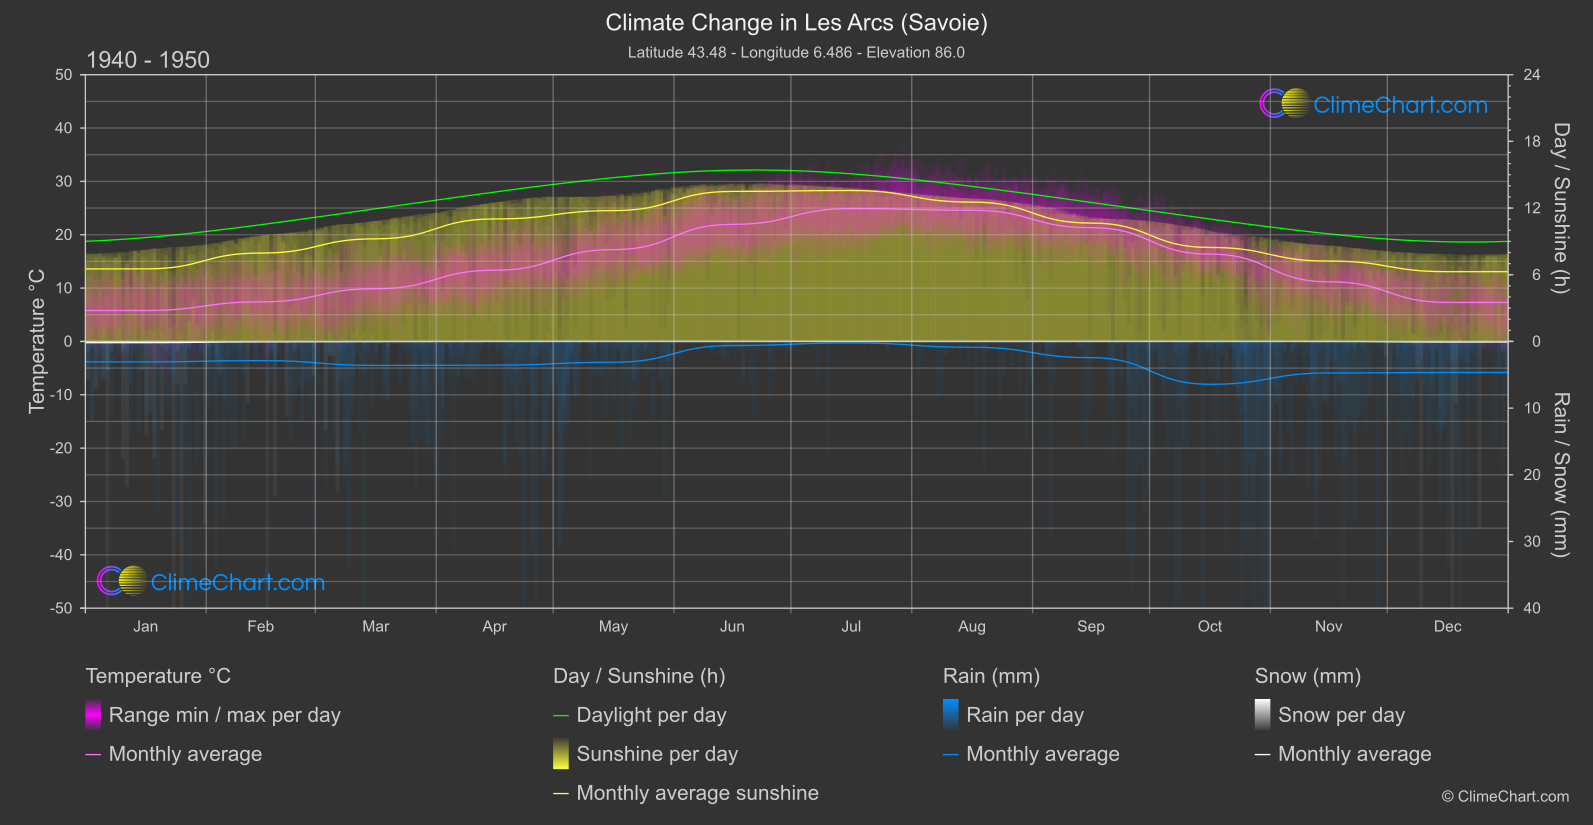
Les Arcs, located in Savoie, France, has witnessed significant changes in its climate over the years. Analyzing the temperature data from the 1940s to 1950s compared to recent years (2013-2024), we observe a consistent increase in temperatures across most months. July stands out as the month with the highest temperature change, showing an increase of 1.02°C. In contrast, September experienced a slight decrease in temperature. Regarding rainfall, November saw the most significant increase in mm of 1.93, while February had the highest percentage change. Snowfall has generally decreased over the years, with notable reductions in December and November. Sunshine duration also showed a decreasing trend, with November experiencing the most significant drop in hours of sunshine.
Climate Change Data Overview for Les Arcs (Savoie), France
Explore the comprehensive climate change data for Les Arcs (Savoie), France. This detailed table provides valuable insights into temperature variations, precipitation levels, and seasonal changes influenced by climate change, helping you understand the unique weather patterns of this region.
Temperature °C
| Month | ⌀ 1940 - 1950 | ⌀ 2013 - 2023 | +/- |
|---|---|---|---|
| Jan | 5.80 | 7.38 | 1.58 |
| Feb | 7.42 | 8.35 | 0.93 |
| Mar | 9.87 | 10.76 | 0.88 |
| Apr | 13.35 | 13.85 | 0.50 |
| May | 17.22 | 17.57 | 0.36 |
| Jun | 21.94 | 22.75 | 0.81 |
| Jul | 24.90 | 25.93 | 1.02 |
| Aug | 24.58 | 25.42 | 0.84 |
| Sep | 21.32 | 21.24 | -0.07 |
| Oct | 16.37 | 16.79 | 0.42 |
| Nov | 11.18 | 11.54 | 0.37 |
| Dec | 7.31 | 8.48 | 1.16 |
| ⌀ Month | 15.11 | 15.84 | 0.73 |
Sunshine (h)
| Month | ⌀ 1940 - 1950 | ⌀ 2013 - 2023 | +/- |
|---|---|---|---|
| Jan | 6.53 | 6.62 | 0.10 |
| Feb | 7.95 | 7.49 | -0.46 |
| Mar | 9.23 | 9.14 | -0.10 |
| Apr | 11.02 | 10.63 | -0.39 |
| May | 11.77 | 11.55 | -0.22 |
| Jun | 13.50 | 13.07 | -0.43 |
| Jul | 13.58 | 13.38 | -0.20 |
| Aug | 12.53 | 12.32 | -0.21 |
| Sep | 10.65 | 10.46 | -0.18 |
| Oct | 8.45 | 8.13 | -0.32 |
| Nov | 7.23 | 6.68 | -0.55 |
| Dec | 6.27 | 6.23 | -0.04 |
| ⌀ Month | 9.89 | 9.64 | -0.25 |
Rain (mm)
| Month | ⌀ 1940 - 1950 | ⌀ 2013 - 2023 | +/- |
|---|---|---|---|
| Jan | 1.53 | 1.92 | 0.39 |
| Feb | 1.44 | 2.18 | 0.74 |
| Mar | 1.80 | 1.90 | 0.10 |
| Apr | 1.78 | 2.09 | 0.31 |
| May | 1.56 | 1.87 | 0.31 |
| Jun | 0.31 | 1.23 | 0.92 |
| Jul | 0.11 | 0.39 | 0.28 |
| Aug | 0.44 | 0.65 | 0.22 |
| Sep | 1.22 | 1.37 | 0.15 |
| Oct | 3.21 | 3.61 | 0.40 |
| Nov | 2.37 | 4.29 | 1.93 |
| Dec | 2.33 | 2.60 | 0.28 |
| ⌀ Month | 1.51 | 2.01 | 0.50 |
Snow (mm)
| Month | ⌀ 1940 - 1950 | ⌀ 2013 - 2023 | +/- |
|---|---|---|---|
| Jan | 0.09 | 0.01 | -0.08 |
| Feb | 0.03 | 0.06 | 0.03 |
| Mar | 0.01 | 0.00 | -0.01 |
| Apr | 0.00 | 0.00 | 0.00 |
| May | 0.00 | 0.00 | 0.00 |
| Jun | 0.00 | 0.00 | 0.00 |
| Jul | 0.00 | 0.00 | 0.00 |
| Aug | 0.00 | 0.00 | 0.00 |
| Sep | 0.00 | 0.00 | 0.00 |
| Oct | 0.00 | 0.00 | 0.00 |
| Nov | 0.00 | 0.00 | -0.00 |
| Dec | 0.05 | 0.02 | -0.02 |
| ⌀ Month | 0.02 | 0.01 | -0.01 |