Climate Change Chart of Lansing, USA
Comprehensive Climate Change Chart of Lansing, USA: Monthly Averages and Impact Trends
Exploring the changing climate in Lansing, USA reveals fascinating insights into temperature, rainfall, snowfall, and sunshine duration over the years.
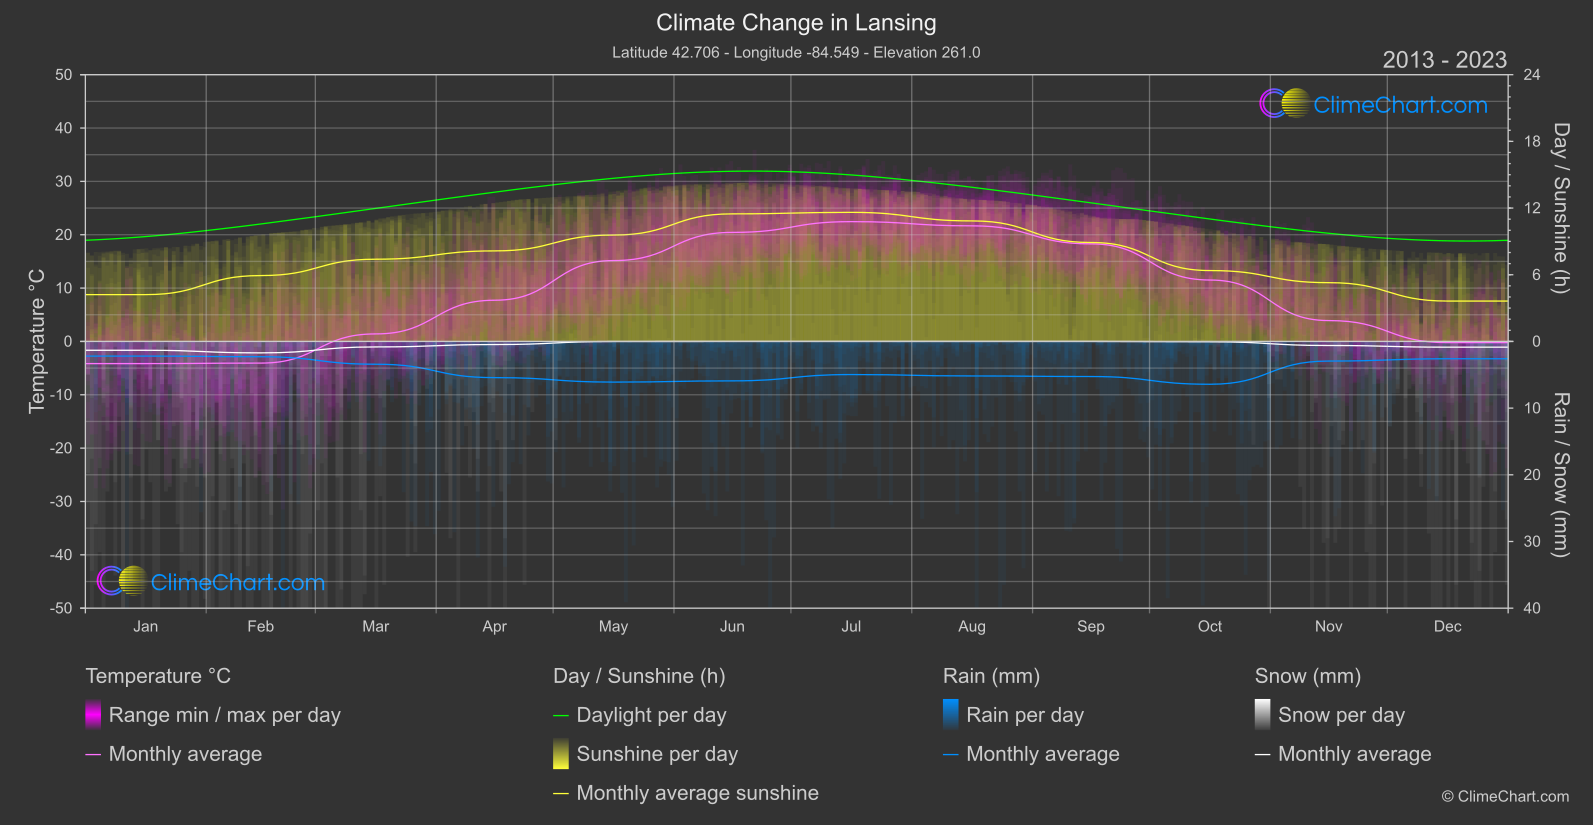
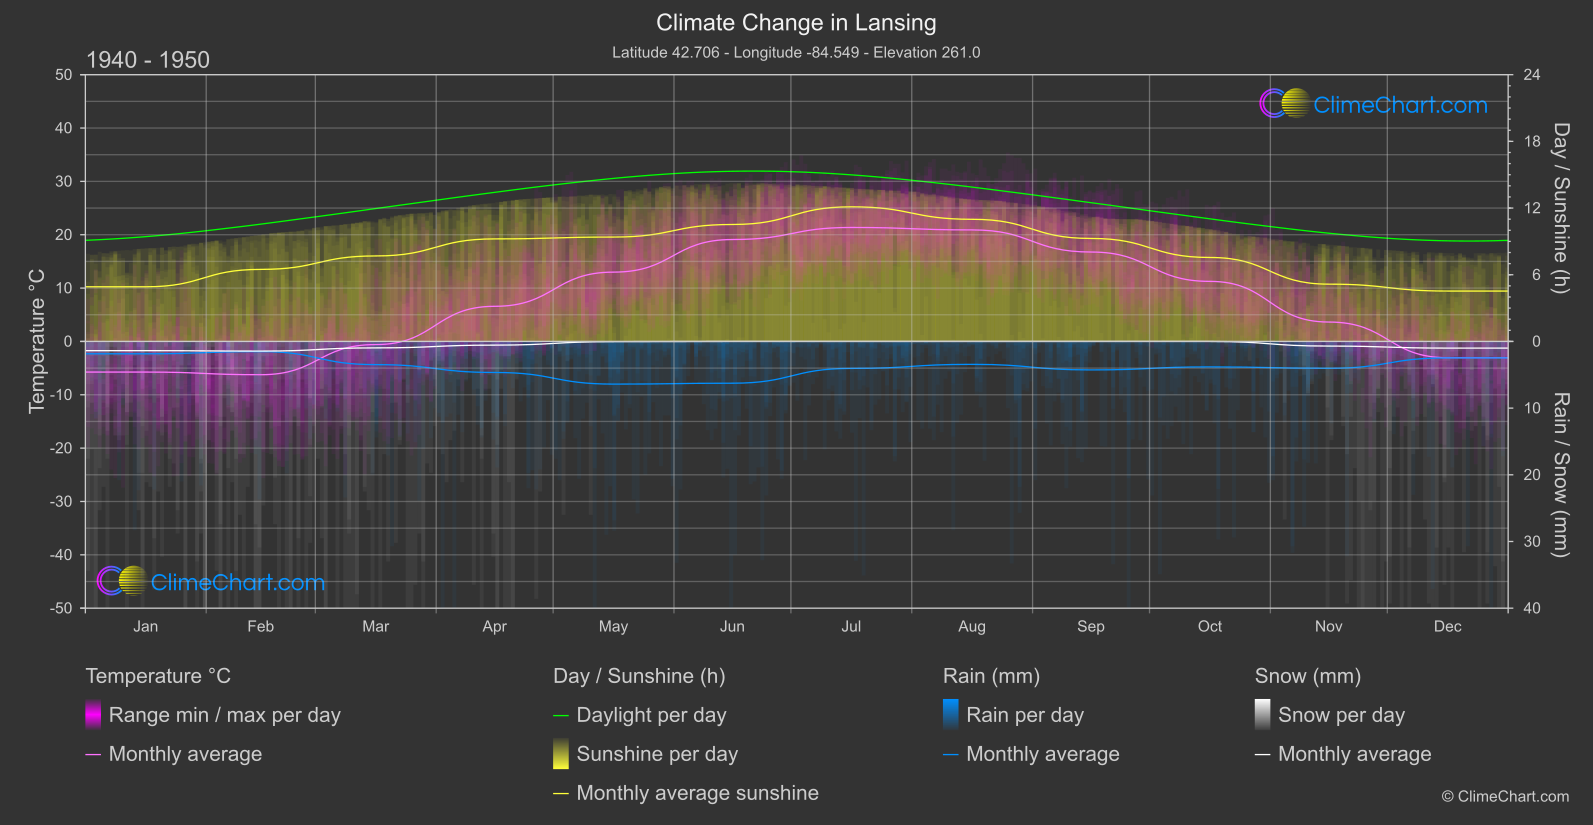
Lansing, USA has experienced significant changes in its climate patterns over the years. Analyzing the temperature data, we find that May shows the highest increase in temperature from 1940-1950 to 2013-2024, with a change of 2.17°C. In terms of rainfall, the month of October has the most noticeable change with an increase of 1.30mm. Snowfall has decreased overall, with October showing a minor increase. Additionally, sunshine duration has fluctuated, with June experiencing the highest increase in sunlight hours by 0.96 hours.
Climate Change Data Overview for Lansing, USA
Explore the comprehensive climate change data for Lansing, USA. This detailed table provides valuable insights into temperature variations, precipitation levels, and seasonal changes influenced by climate change, helping you understand the unique weather patterns of this region.
Temperature °C
| Month | ⌀ 1940 - 1950 | ⌀ 2013 - 2023 | +/- |
|---|---|---|---|
| Jan | -5.74 | -4.15 | 1.59 |
| Feb | -6.24 | -4.06 | 2.18 |
| Mar | -0.59 | 1.41 | 2.00 |
| Apr | 6.58 | 7.72 | 1.14 |
| May | 12.99 | 15.16 | 2.17 |
| Jun | 19.10 | 20.44 | 1.33 |
| Jul | 21.36 | 22.46 | 1.09 |
| Aug | 20.90 | 21.67 | 0.76 |
| Sep | 16.76 | 18.29 | 1.53 |
| Oct | 11.26 | 11.51 | 0.25 |
| Nov | 3.63 | 3.91 | 0.28 |
| Dec | -3.05 | -0.23 | 2.82 |
| ⌀ Month | 8.08 | 9.51 | 1.43 |
Sunshine (h)
| Month | ⌀ 1940 - 1950 | ⌀ 2013 - 2023 | +/- |
|---|---|---|---|
| Jan | 4.92 | 4.21 | -0.71 |
| Feb | 6.48 | 5.93 | -0.56 |
| Mar | 7.69 | 7.40 | -0.29 |
| Apr | 9.23 | 8.15 | -1.08 |
| May | 9.39 | 9.57 | 0.18 |
| Jun | 10.52 | 11.48 | 0.96 |
| Jul | 12.11 | 11.61 | -0.50 |
| Aug | 10.99 | 10.84 | -0.14 |
| Sep | 9.27 | 8.90 | -0.37 |
| Oct | 7.55 | 6.38 | -1.18 |
| Nov | 5.15 | 5.29 | 0.13 |
| Dec | 4.53 | 3.63 | -0.90 |
| ⌀ Month | 8.15 | 7.78 | -0.37 |
Rain (mm)
| Month | ⌀ 1940 - 1950 | ⌀ 2013 - 2023 | +/- |
|---|---|---|---|
| Jan | 0.93 | 1.10 | 0.17 |
| Feb | 0.76 | 1.15 | 0.39 |
| Mar | 1.74 | 1.71 | -0.03 |
| Apr | 2.33 | 2.71 | 0.39 |
| May | 3.20 | 3.05 | -0.15 |
| Jun | 3.13 | 2.96 | -0.18 |
| Jul | 2.02 | 2.48 | 0.46 |
| Aug | 1.72 | 2.59 | 0.87 |
| Sep | 2.14 | 2.63 | 0.50 |
| Oct | 1.91 | 3.21 | 1.30 |
| Nov | 2.01 | 1.47 | -0.54 |
| Dec | 1.23 | 1.30 | 0.07 |
| ⌀ Month | 1.93 | 2.20 | 0.27 |
Snow (mm)
| Month | ⌀ 1940 - 1950 | ⌀ 2013 - 2023 | +/- |
|---|---|---|---|
| Jan | 0.69 | 0.66 | -0.03 |
| Feb | 0.72 | 0.86 | 0.13 |
| Mar | 0.48 | 0.41 | -0.07 |
| Apr | 0.28 | 0.23 | -0.04 |
| May | 0.02 | 0.01 | -0.01 |
| Jun | 0.00 | 0.00 | 0.00 |
| Jul | 0.00 | 0.00 | 0.00 |
| Aug | 0.00 | 0.00 | 0.00 |
| Sep | 0.00 | 0.00 | 0.00 |
| Oct | 0.00 | 0.03 | 0.03 |
| Nov | 0.35 | 0.30 | -0.04 |
| Dec | 0.50 | 0.43 | -0.07 |
| ⌀ Month | 0.25 | 0.24 | -0.01 |