Climate Change Chart of Laayoune, Morocco
Comprehensive Climate Change Chart of Laayoune, Morocco: Monthly Averages and Impact Trends
Exploring the changing climate in Laayoune, Morocco reveals intriguing insights into temperature, rainfall, and sunshine duration trends over the years.
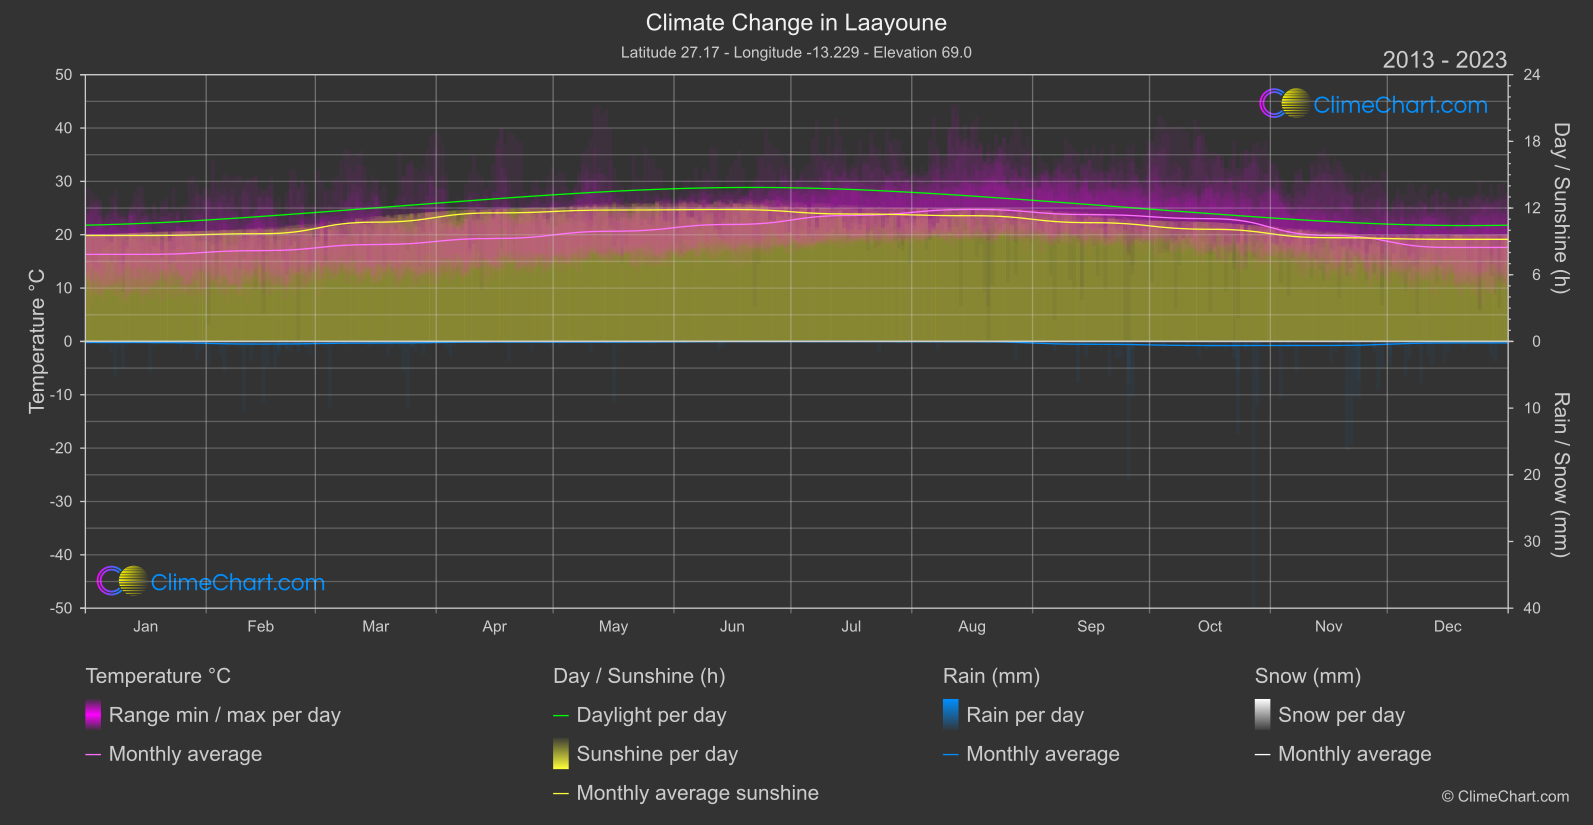
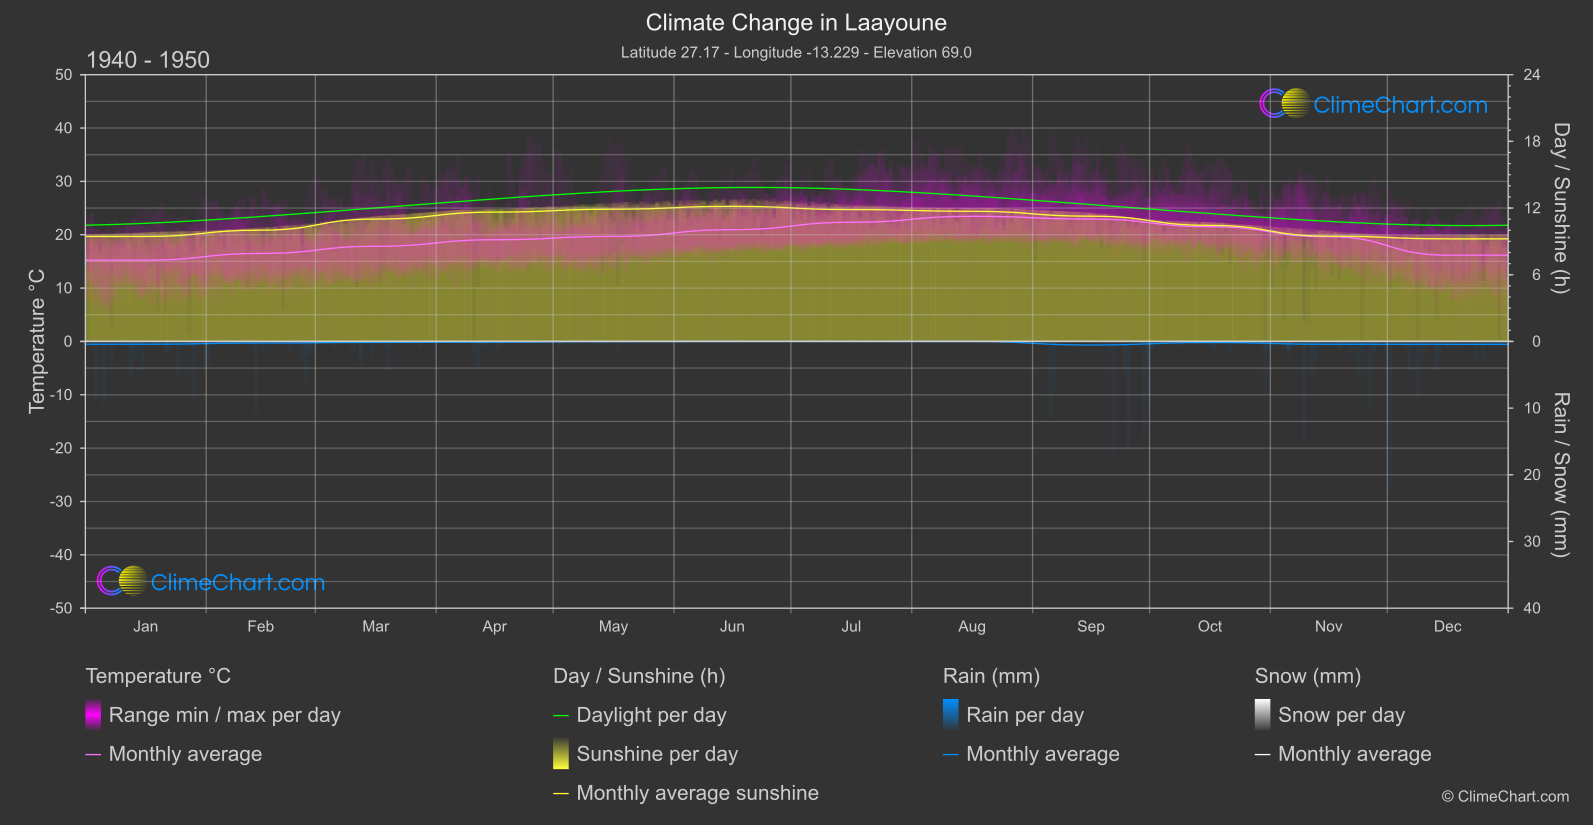
Laayoune, Morocco experiences a notable increase in temperatures from 1940-1950 to 2013-2024. The month with the highest temperature change is August, showing a significant rise of 1.30°C. In terms of rainfall, the data indicates fluctuating patterns with October displaying the largest increase in rainfall of 22.67mm. Sunshine duration also shows variations, with September having the most significant decrease in sunshine hours by 0.58 hours.
Climate Change Data Overview for Laayoune, Morocco
Explore the comprehensive climate change data for Laayoune, Morocco. This detailed table provides valuable insights into temperature variations, precipitation levels, and seasonal changes influenced by climate change, helping you understand the unique weather patterns of this region.
Temperature °C
| Month | ⌀ 1940 - 1950 | ⌀ 2013 - 2023 | +/- |
|---|---|---|---|
| Jan | 15.24 | 16.32 | 1.08 |
| Feb | 16.49 | 17.02 | 0.53 |
| Mar | 17.83 | 18.16 | 0.33 |
| Apr | 19.06 | 19.30 | 0.24 |
| May | 19.68 | 20.66 | 0.98 |
| Jun | 20.95 | 21.93 | 0.98 |
| Jul | 22.33 | 23.62 | 1.28 |
| Aug | 23.45 | 24.75 | 1.30 |
| Sep | 22.94 | 23.76 | 0.83 |
| Oct | 21.51 | 23.01 | 1.50 |
| Nov | 19.63 | 19.87 | 0.24 |
| Dec | 16.17 | 17.62 | 1.45 |
| ⌀ Month | 19.61 | 20.50 | 0.90 |
Sunshine (h)
| Month | ⌀ 1940 - 1950 | ⌀ 2013 - 2023 | +/- |
|---|---|---|---|
| Jan | 9.44 | 9.53 | 0.09 |
| Feb | 10.01 | 9.69 | -0.32 |
| Mar | 11.01 | 10.73 | -0.28 |
| Apr | 11.64 | 11.57 | -0.07 |
| May | 11.90 | 11.82 | -0.07 |
| Jun | 12.15 | 11.87 | -0.28 |
| Jul | 11.86 | 11.46 | -0.40 |
| Aug | 11.71 | 11.31 | -0.40 |
| Sep | 11.27 | 10.69 | -0.58 |
| Oct | 10.44 | 10.09 | -0.35 |
| Nov | 9.47 | 9.33 | -0.14 |
| Dec | 9.23 | 9.19 | -0.04 |
| ⌀ Month | 10.84 | 10.61 | -0.24 |
Rain (mm)
| Month | ⌀ 1940 - 1950 | ⌀ 2013 - 2023 | +/- |
|---|---|---|---|
| Jan | 0.21 | 0.08 | -0.13 |
| Feb | 0.12 | 0.19 | 0.07 |
| Mar | 0.07 | 0.12 | 0.05 |
| Apr | 0.05 | 0.05 | -0.00 |
| May | 0.02 | 0.05 | 0.03 |
| Jun | 0.00 | 0.01 | 0.01 |
| Jul | 0.00 | 0.01 | 0.01 |
| Aug | 0.00 | 0.02 | 0.02 |
| Sep | 0.27 | 0.21 | -0.06 |
| Oct | 0.08 | 0.31 | 0.23 |
| Nov | 0.21 | 0.30 | 0.09 |
| Dec | 0.22 | 0.12 | -0.10 |
| ⌀ Month | 0.10 | 0.12 | 0.02 |
Snow (mm)
| Month | ⌀ 1940 - 1950 | ⌀ 2013 - 2023 | +/- |
|---|---|---|---|
| Jan | 0.00 | 0.00 | 0.00 |
| Feb | 0.00 | 0.00 | 0.00 |
| Mar | 0.00 | 0.00 | 0.00 |
| Apr | 0.00 | 0.00 | 0.00 |
| May | 0.00 | 0.00 | 0.00 |
| Jun | 0.00 | 0.00 | 0.00 |
| Jul | 0.00 | 0.00 | 0.00 |
| Aug | 0.00 | 0.00 | 0.00 |
| Sep | 0.00 | 0.00 | 0.00 |
| Oct | 0.00 | 0.00 | 0.00 |
| Nov | 0.00 | 0.00 | 0.00 |
| Dec | 0.00 | 0.00 | 0.00 |
| ⌀ Month | 0.00 | 0.00 | 0.00 |