Climate Change Chart of Ibiza, Spain
Comprehensive Climate Change Chart of Ibiza, Spain: Monthly Averages and Impact Trends
Explore the changing climate in Ibiza, Spain with insightful data analysis. Discover the trends in temperature, rainfall, snowfall, and sunshine duration from 1940 to 1950 compared to 2013 to 2024.
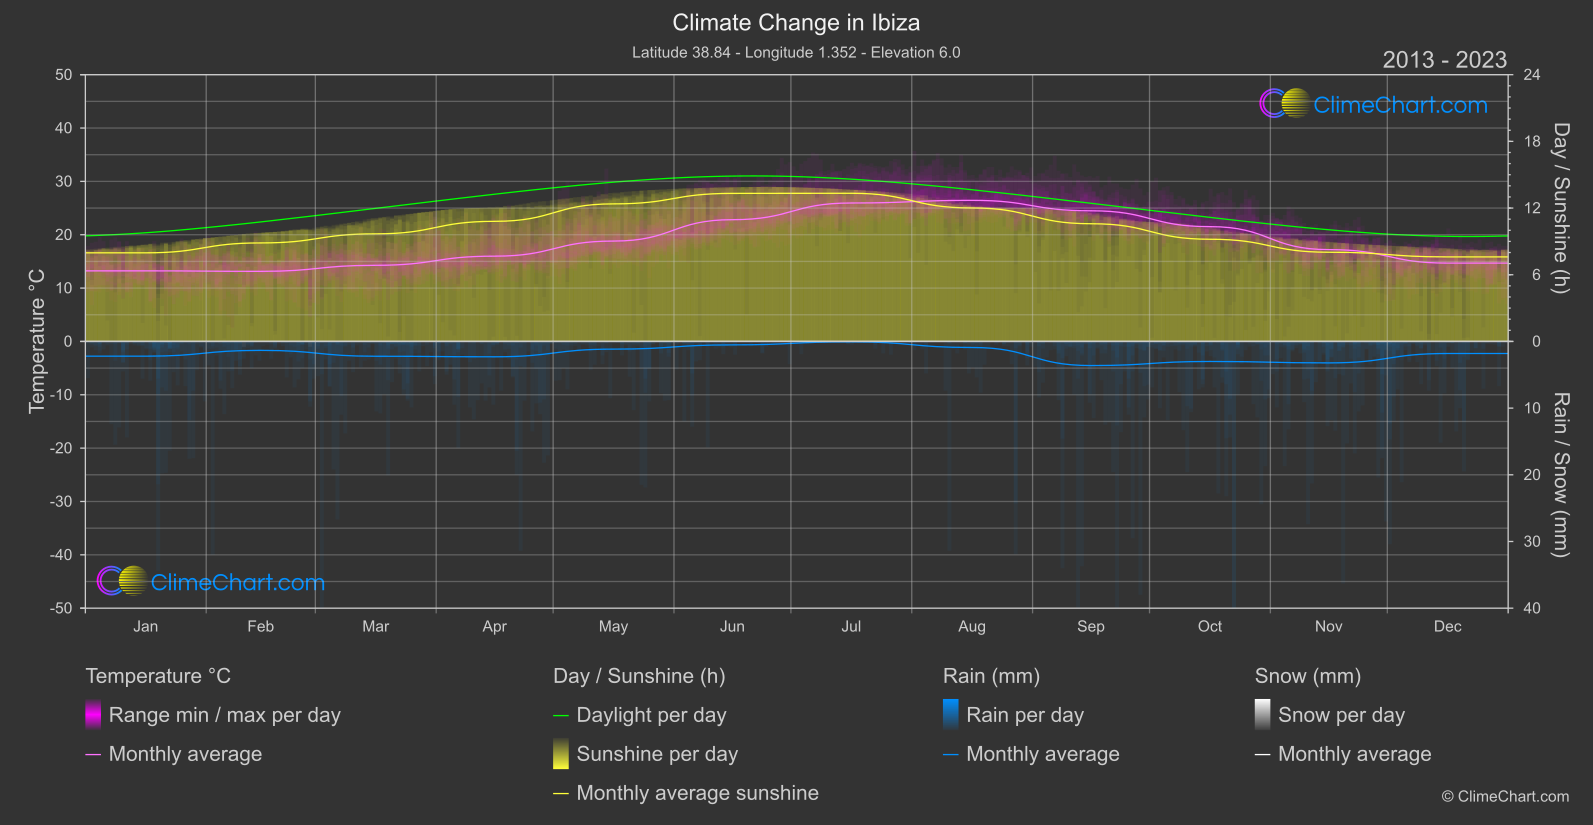
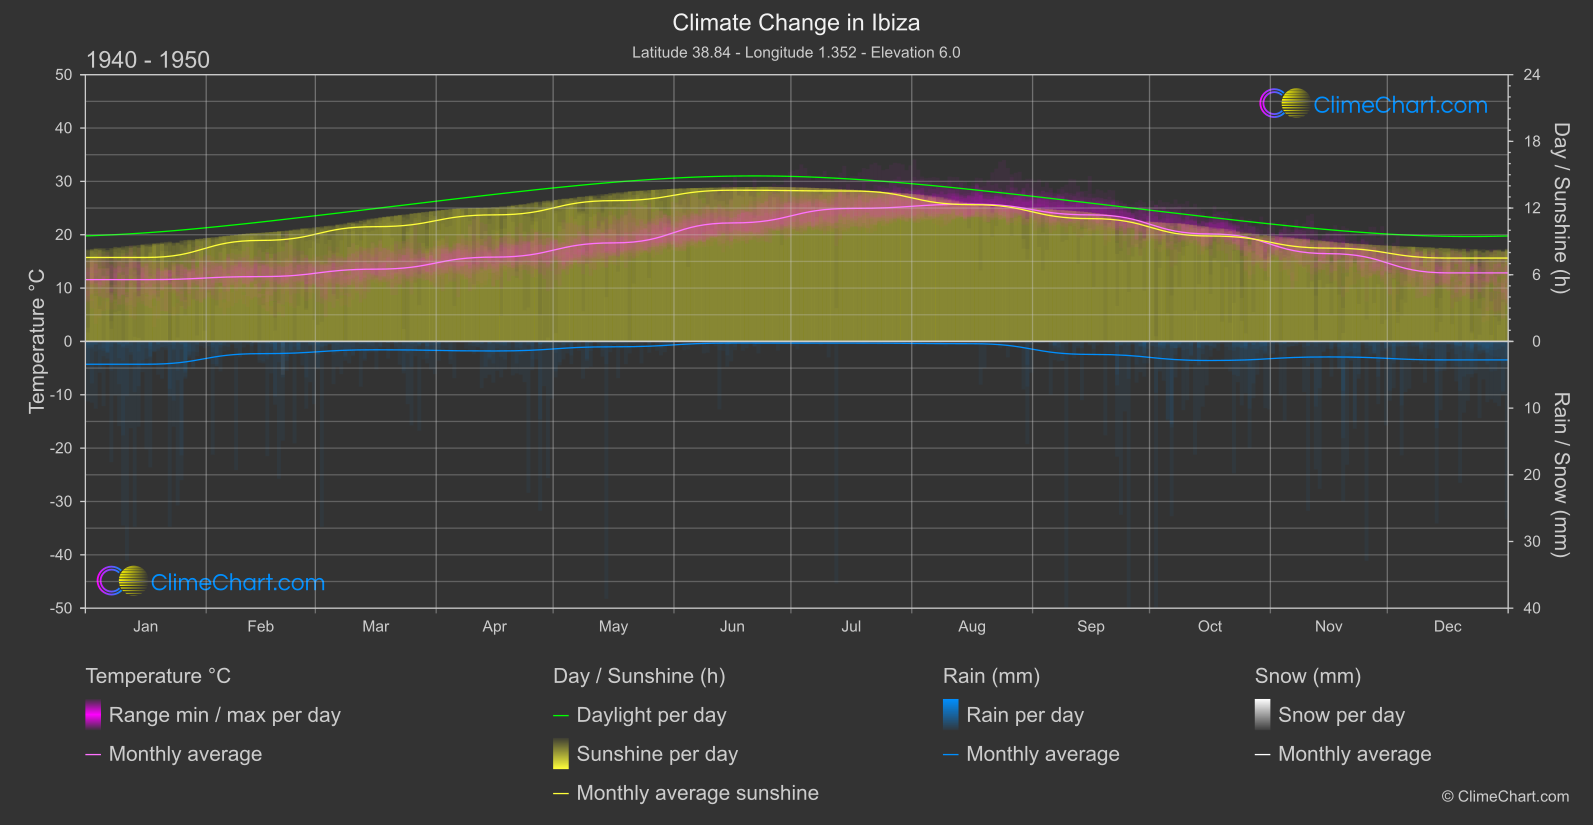
Ibiza, Spain experiences notable changes in climate indicators over the years. The data shows that the month with the highest temperature change is December, with a significant increase of 1.83°C. Additionally, September sees the most substantial rise in rainfall, with an increase of 0.83 mm compared to the data from the 1940s. While snowfall remains minimal in Ibiza, the sunshine duration displays a decrease across the months, with March showing the most significant drop of 0.64 hours.
Climate Change Data Overview for Ibiza, Spain
Explore the comprehensive climate change data for Ibiza, Spain. This detailed table provides valuable insights into temperature variations, precipitation levels, and seasonal changes influenced by climate change, helping you understand the unique weather patterns of this region.
Temperature °C
| Month | ⌀ 1940 - 1950 | ⌀ 2013 - 2023 | +/- |
|---|---|---|---|
| Jan | 11.58 | 13.23 | 1.65 |
| Feb | 12.15 | 13.14 | 0.98 |
| Mar | 13.55 | 14.27 | 0.72 |
| Apr | 15.81 | 15.98 | 0.18 |
| May | 18.47 | 18.81 | 0.34 |
| Jun | 22.21 | 22.82 | 0.61 |
| Jul | 24.93 | 25.95 | 1.01 |
| Aug | 25.72 | 26.44 | 0.72 |
| Sep | 23.72 | 24.49 | 0.77 |
| Oct | 20.15 | 21.52 | 1.37 |
| Nov | 16.45 | 17.21 | 0.76 |
| Dec | 12.85 | 14.68 | 1.83 |
| ⌀ Month | 18.13 | 19.05 | 0.91 |
Sunshine (h)
| Month | ⌀ 1940 - 1950 | ⌀ 2013 - 2023 | +/- |
|---|---|---|---|
| Jan | 7.56 | 7.97 | 0.42 |
| Feb | 9.09 | 8.86 | -0.23 |
| Mar | 10.33 | 9.68 | -0.65 |
| Apr | 11.39 | 10.81 | -0.58 |
| May | 12.67 | 12.38 | -0.29 |
| Jun | 13.61 | 13.32 | -0.29 |
| Jul | 13.53 | 13.33 | -0.20 |
| Aug | 12.30 | 12.01 | -0.30 |
| Sep | 11.05 | 10.59 | -0.46 |
| Oct | 9.49 | 9.19 | -0.29 |
| Nov | 8.39 | 8.03 | -0.37 |
| Dec | 7.50 | 7.61 | 0.10 |
| ⌀ Month | 10.58 | 10.31 | -0.26 |
Rain (mm)
| Month | ⌀ 1940 - 1950 | ⌀ 2013 - 2023 | +/- |
|---|---|---|---|
| Jan | 1.71 | 1.11 | -0.60 |
| Feb | 0.92 | 0.67 | -0.25 |
| Mar | 0.63 | 1.11 | 0.48 |
| Apr | 0.71 | 1.15 | 0.44 |
| May | 0.40 | 0.58 | 0.17 |
| Jun | 0.12 | 0.26 | 0.14 |
| Jul | 0.13 | 0.03 | -0.09 |
| Aug | 0.17 | 0.45 | 0.29 |
| Sep | 0.97 | 1.81 | 0.83 |
| Oct | 1.43 | 1.50 | 0.07 |
| Nov | 1.16 | 1.61 | 0.45 |
| Dec | 1.39 | 0.90 | -0.48 |
| ⌀ Month | 0.81 | 0.93 | 0.12 |
Snow (mm)
| Month | ⌀ 1940 - 1950 | ⌀ 2013 - 2023 | +/- |
|---|---|---|---|
| Jan | 0.00 | 0.00 | 0.00 |
| Feb | 0.00 | 0.00 | -0.00 |
| Mar | 0.00 | 0.00 | 0.00 |
| Apr | 0.00 | 0.00 | 0.00 |
| May | 0.00 | 0.00 | 0.00 |
| Jun | 0.00 | 0.00 | 0.00 |
| Jul | 0.00 | 0.00 | 0.00 |
| Aug | 0.00 | 0.00 | 0.00 |
| Sep | 0.00 | 0.00 | 0.00 |
| Oct | 0.00 | 0.00 | 0.00 |
| Nov | 0.00 | 0.00 | 0.00 |
| Dec | 0.00 | 0.00 | 0.00 |
| ⌀ Month | 0.00 | 0.00 | -0.00 |