Climate Change Chart of Houston, USA
Comprehensive Climate Change Chart of Houston, USA: Monthly Averages and Impact Trends
Exploring the climate change data in Houston, United States of America reveals intriguing insights.
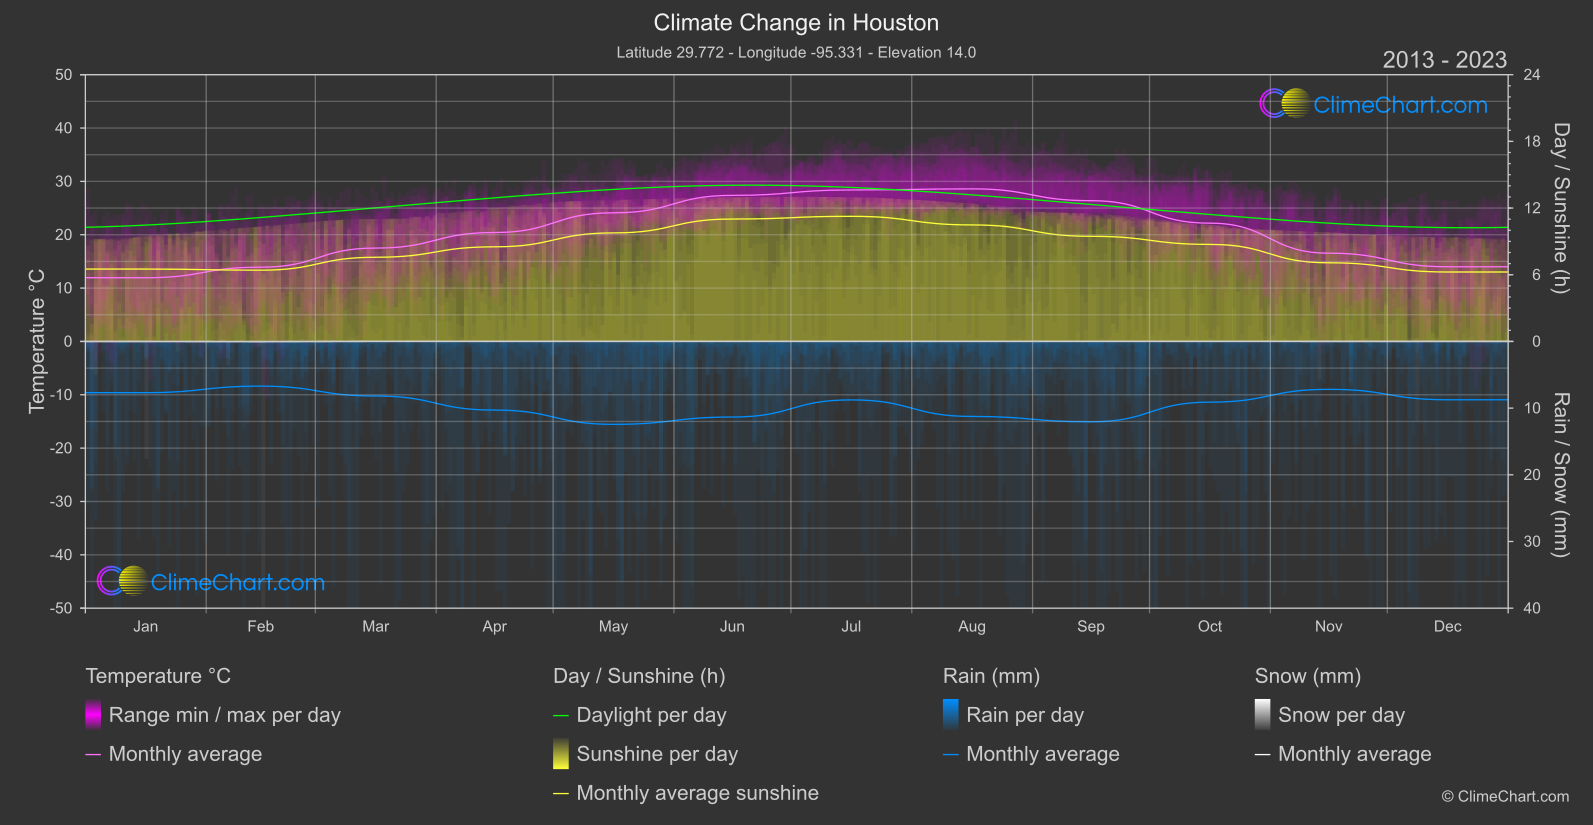
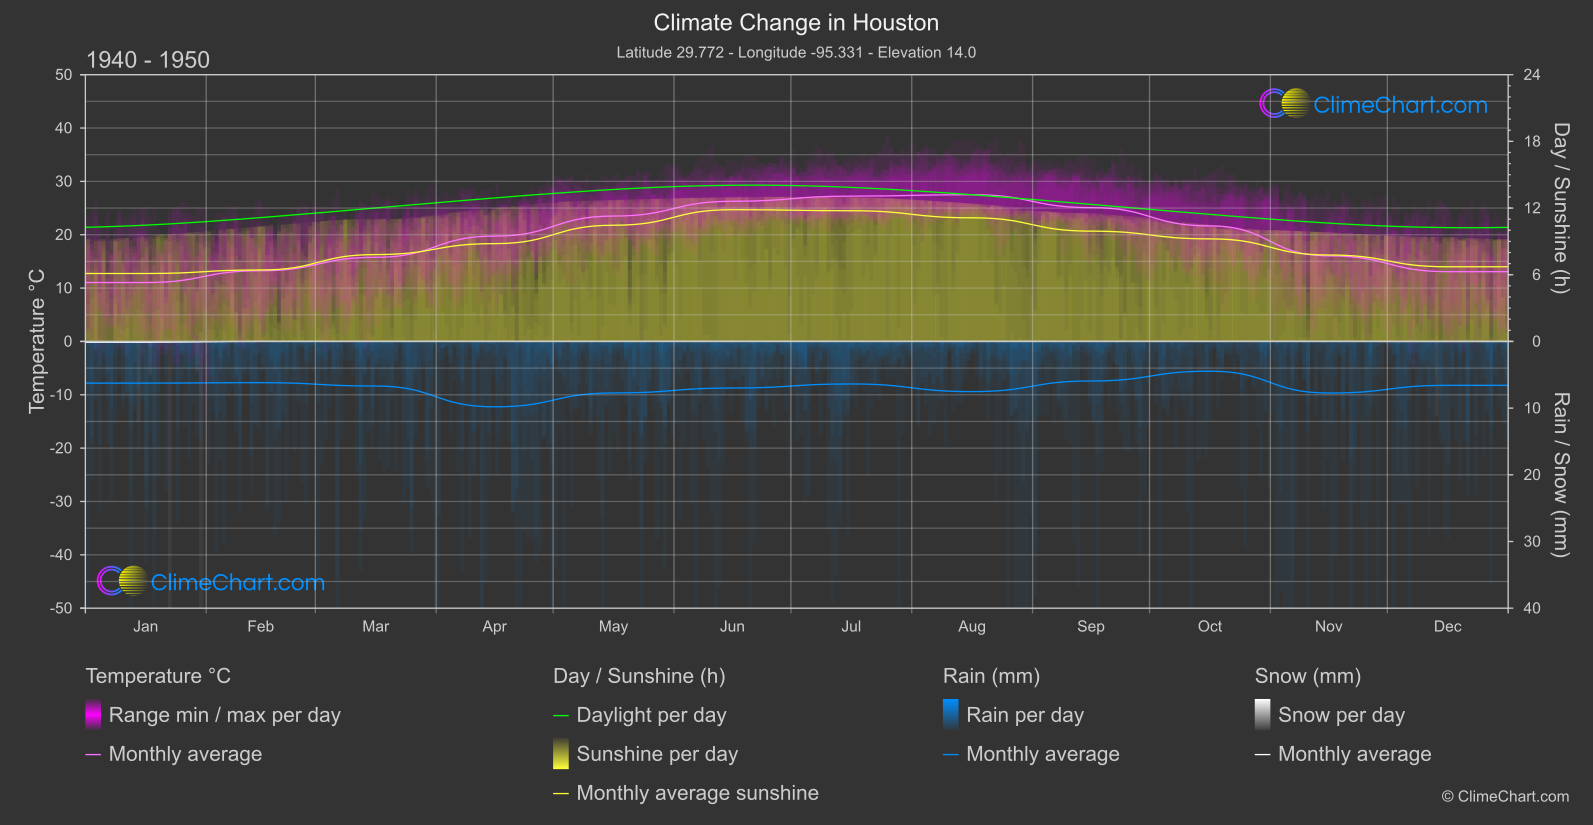
Houston, known for its dynamic climate, has experienced notable changes in temperature, rainfall, snowfall, and sunshine duration over the years. Analyzing the data from the 1940s to the 1950s compared to recent years from 2013 to 2024, we observe significant shifts in various weather parameters. For instance, the month with the highest temperature change is March, while September stands out for the largest change in rainfall. These trends offer valuable insights into the evolving climate patterns in Houston.
Climate Change Data Overview for Houston, USA
Explore the comprehensive climate change data for Houston, USA. This detailed table provides valuable insights into temperature variations, precipitation levels, and seasonal changes influenced by climate change, helping you understand the unique weather patterns of this region.
Temperature °C
| Month | ⌀ 1940 - 1950 | ⌀ 2013 - 2023 | +/- |
|---|---|---|---|
| Jan | 11.04 | 11.94 | 0.90 |
| Feb | 13.25 | 13.92 | 0.67 |
| Mar | 15.76 | 17.50 | 1.74 |
| Apr | 19.75 | 20.42 | 0.67 |
| May | 23.50 | 24.11 | 0.61 |
| Jun | 26.27 | 27.38 | 1.11 |
| Jul | 27.24 | 28.39 | 1.15 |
| Aug | 27.50 | 28.60 | 1.09 |
| Sep | 25.09 | 26.38 | 1.30 |
| Oct | 21.65 | 22.17 | 0.51 |
| Nov | 16.04 | 16.54 | 0.50 |
| Dec | 13.08 | 14.00 | 0.92 |
| ⌀ Month | 20.01 | 20.95 | 0.93 |
Sunshine (h)
| Month | ⌀ 1940 - 1950 | ⌀ 2013 - 2023 | +/- |
|---|---|---|---|
| Jan | 6.11 | 6.51 | 0.40 |
| Feb | 6.43 | 6.41 | -0.02 |
| Mar | 7.81 | 7.57 | -0.24 |
| Apr | 8.80 | 8.51 | -0.29 |
| May | 10.45 | 9.76 | -0.69 |
| Jun | 11.85 | 11.01 | -0.84 |
| Jul | 11.76 | 11.26 | -0.50 |
| Aug | 11.12 | 10.48 | -0.64 |
| Sep | 9.92 | 9.46 | -0.46 |
| Oct | 9.23 | 8.73 | -0.50 |
| Nov | 7.78 | 7.08 | -0.70 |
| Dec | 6.72 | 6.25 | -0.47 |
| ⌀ Month | 9.00 | 8.59 | -0.41 |
Rain (mm)
| Month | ⌀ 1940 - 1950 | ⌀ 2013 - 2023 | +/- |
|---|---|---|---|
| Jan | 3.13 | 3.84 | 0.72 |
| Feb | 3.09 | 3.35 | 0.26 |
| Mar | 3.34 | 4.09 | 0.75 |
| Apr | 4.90 | 5.15 | 0.24 |
| May | 3.86 | 6.22 | 2.35 |
| Jun | 3.49 | 5.67 | 2.18 |
| Jul | 3.19 | 4.38 | 1.19 |
| Aug | 3.76 | 5.62 | 1.86 |
| Sep | 2.97 | 6.03 | 3.06 |
| Oct | 2.23 | 4.55 | 2.32 |
| Nov | 3.87 | 3.59 | -0.28 |
| Dec | 3.29 | 4.37 | 1.08 |
| ⌀ Month | 3.43 | 4.74 | 1.31 |
Snow (mm)
| Month | ⌀ 1940 - 1950 | ⌀ 2013 - 2023 | +/- |
|---|---|---|---|
| Jan | 0.06 | 0.01 | -0.05 |
| Feb | 0.00 | 0.02 | 0.02 |
| Mar | 0.00 | 0.00 | 0.00 |
| Apr | 0.00 | 0.00 | 0.00 |
| May | 0.00 | 0.00 | 0.00 |
| Jun | 0.00 | 0.00 | 0.00 |
| Jul | 0.00 | 0.00 | 0.00 |
| Aug | 0.00 | 0.00 | 0.00 |
| Sep | 0.00 | 0.00 | 0.00 |
| Oct | 0.00 | 0.00 | 0.00 |
| Nov | 0.00 | 0.00 | 0.00 |
| Dec | 0.00 | 0.00 | 0.00 |
| ⌀ Month | 0.01 | 0.00 | -0.00 |