Climate Change Chart of Hangzhou, China
Comprehensive Climate Change Chart of Hangzhou, China: Monthly Averages and Impact Trends
Exploring the climate changes in Hangzhou, China reveals intriguing insights into the temperature, rainfall, snowfall, and sunshine duration from 1940 to 1950 compared to 2013 to 2024.
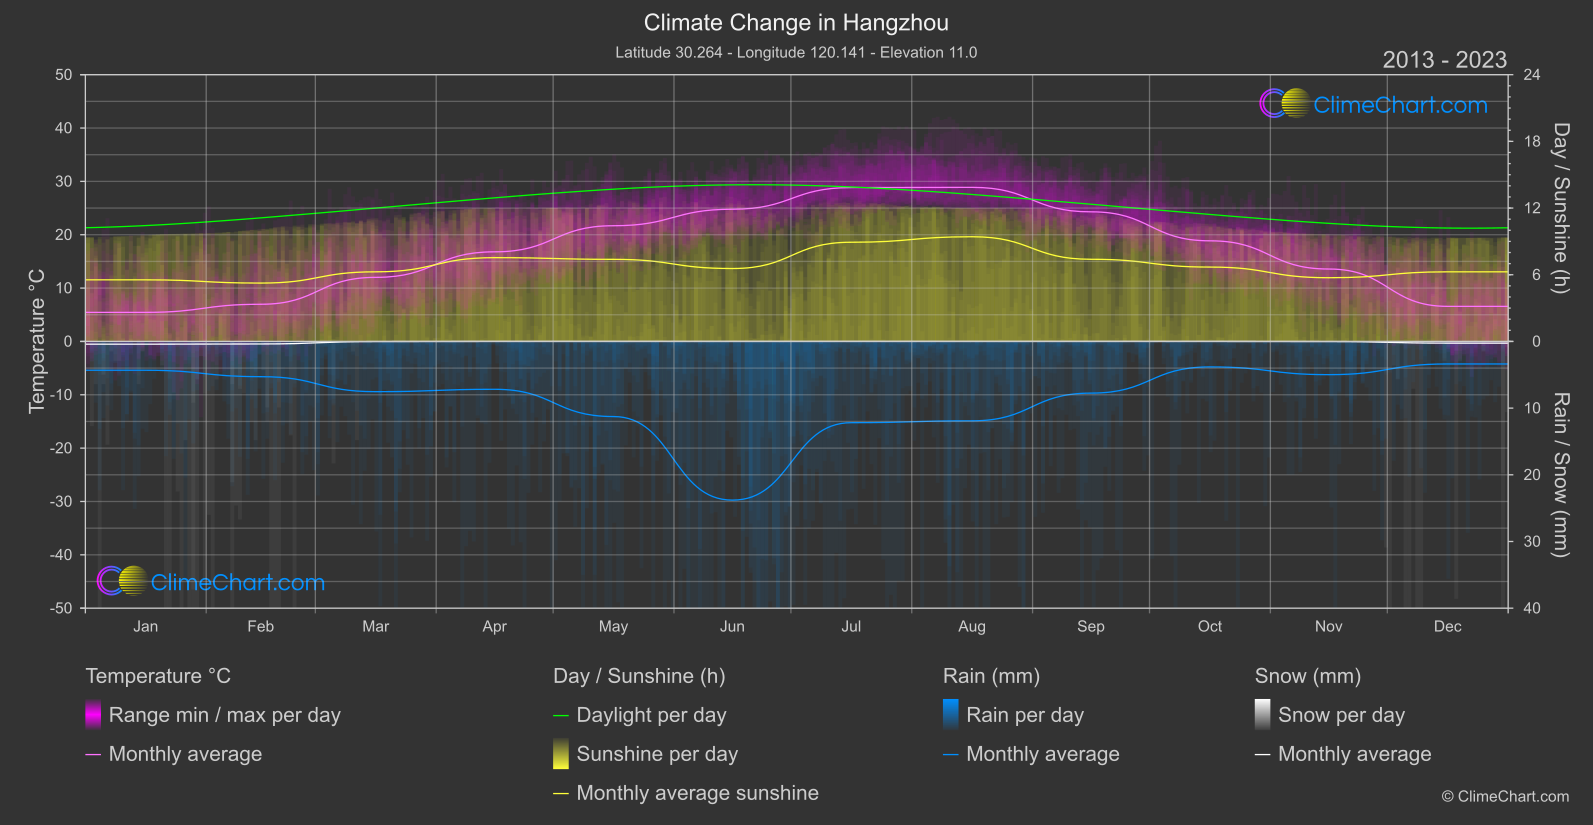
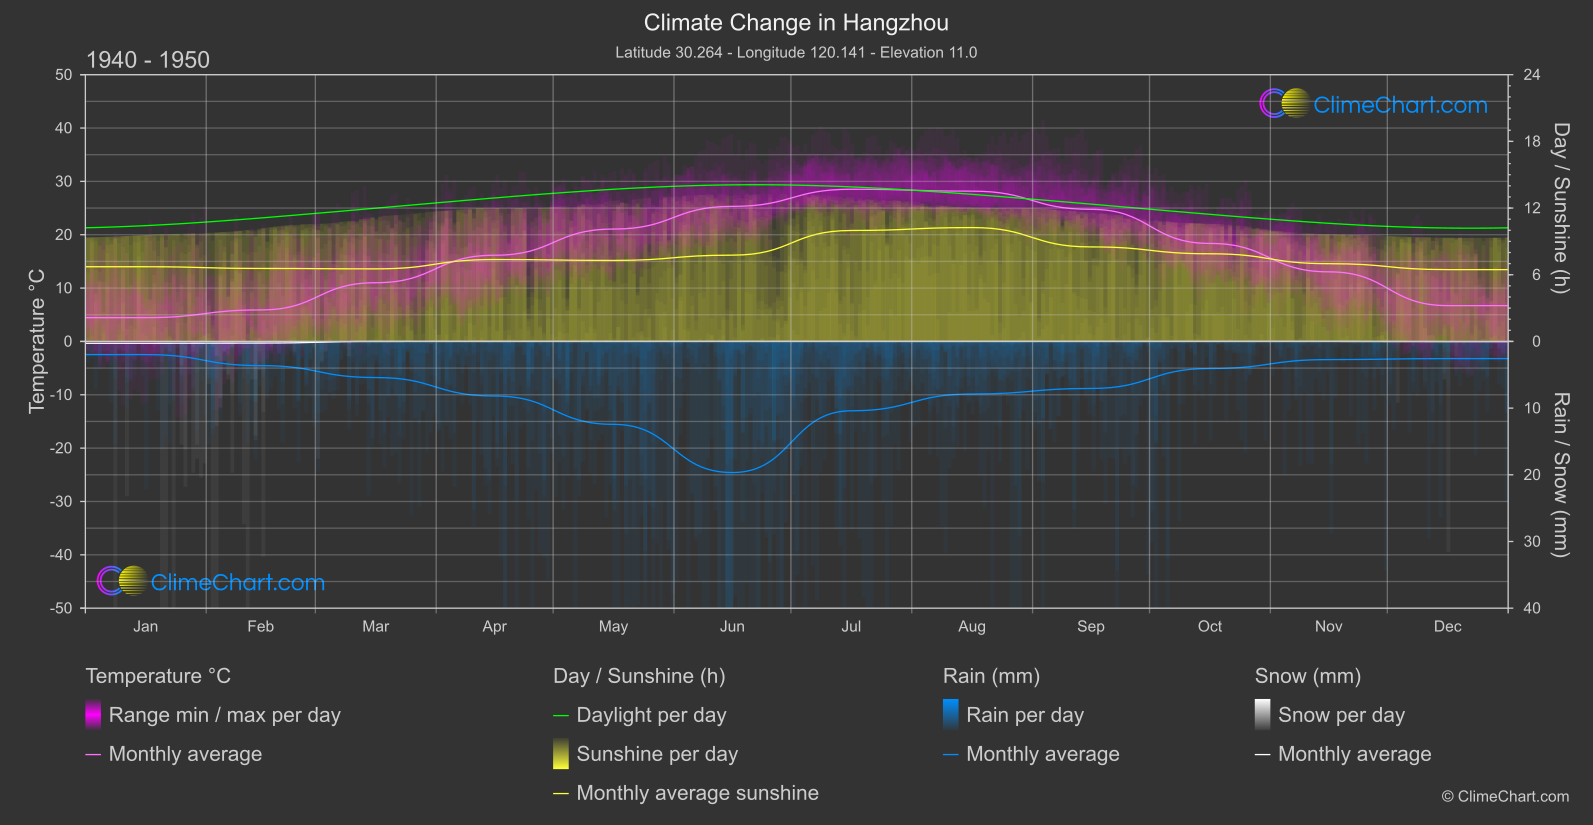
Hangzhou, known for its picturesque scenery, has experienced notable changes in climate over the years. The data shows that June witnessed a decrease in temperature from 1940 to 1950 to 2013 to 2024. Additionally, August saw an increase in rainfall during the same period. Furthermore, the sunshine duration in July decreased significantly in the recent years compared to the past.
Climate Change Data Overview for Hangzhou, China
Explore the comprehensive climate change data for Hangzhou, China. This detailed table provides valuable insights into temperature variations, precipitation levels, and seasonal changes influenced by climate change, helping you understand the unique weather patterns of this region.
Temperature °C
| Month | ⌀ 1940 - 1950 | ⌀ 2013 - 2023 | +/- |
|---|---|---|---|
| Jan | 4.46 | 5.45 | 0.99 |
| Feb | 5.90 | 6.97 | 1.06 |
| Mar | 11.00 | 12.01 | 1.00 |
| Apr | 16.16 | 16.80 | 0.64 |
| May | 21.06 | 21.69 | 0.62 |
| Jun | 25.32 | 24.78 | -0.54 |
| Jul | 28.52 | 28.84 | 0.32 |
| Aug | 28.17 | 28.88 | 0.71 |
| Sep | 24.76 | 24.29 | -0.47 |
| Oct | 18.37 | 18.86 | 0.49 |
| Nov | 13.04 | 13.57 | 0.53 |
| Dec | 6.71 | 6.57 | -0.14 |
| ⌀ Month | 16.96 | 17.39 | 0.44 |
Sunshine (h)
| Month | ⌀ 1940 - 1950 | ⌀ 2013 - 2023 | +/- |
|---|---|---|---|
| Jan | 6.72 | 5.54 | -1.18 |
| Feb | 6.57 | 5.25 | -1.32 |
| Mar | 6.53 | 6.26 | -0.27 |
| Apr | 7.37 | 7.54 | 0.17 |
| May | 7.29 | 7.39 | 0.10 |
| Jun | 7.76 | 6.56 | -1.20 |
| Jul | 9.98 | 8.92 | -1.06 |
| Aug | 10.24 | 9.42 | -0.82 |
| Sep | 8.50 | 7.39 | -1.11 |
| Oct | 7.89 | 6.69 | -1.20 |
| Nov | 6.99 | 5.73 | -1.26 |
| Dec | 6.46 | 6.26 | -0.20 |
| ⌀ Month | 7.69 | 6.91 | -0.78 |
Rain (mm)
| Month | ⌀ 1940 - 1950 | ⌀ 2013 - 2023 | +/- |
|---|---|---|---|
| Jan | 0.99 | 2.16 | 1.17 |
| Feb | 1.81 | 2.64 | 0.83 |
| Mar | 2.71 | 3.77 | 1.06 |
| Apr | 4.09 | 3.59 | -0.50 |
| May | 6.22 | 5.63 | -0.58 |
| Jun | 9.83 | 11.90 | 2.07 |
| Jul | 5.20 | 6.09 | 0.89 |
| Aug | 3.94 | 5.95 | 2.01 |
| Sep | 3.52 | 3.87 | 0.35 |
| Oct | 2.03 | 1.91 | -0.12 |
| Nov | 1.36 | 2.49 | 1.13 |
| Dec | 1.29 | 1.69 | 0.40 |
| ⌀ Month | 3.58 | 4.31 | 0.73 |
Snow (mm)
| Month | ⌀ 1940 - 1950 | ⌀ 2013 - 2023 | +/- |
|---|---|---|---|
| Jan | 0.14 | 0.21 | 0.06 |
| Feb | 0.12 | 0.19 | 0.07 |
| Mar | 0.00 | 0.01 | 0.01 |
| Apr | 0.00 | 0.00 | 0.00 |
| May | 0.00 | 0.00 | 0.00 |
| Jun | 0.00 | 0.00 | 0.00 |
| Jul | 0.00 | 0.00 | 0.00 |
| Aug | 0.00 | 0.00 | 0.00 |
| Sep | 0.00 | 0.00 | 0.00 |
| Oct | 0.00 | 0.00 | 0.00 |
| Nov | 0.00 | 0.01 | 0.01 |
| Dec | 0.01 | 0.13 | 0.11 |
| ⌀ Month | 0.02 | 0.05 | 0.02 |