Climate Change Chart of Graz, Austria
Comprehensive Climate Change Chart of Graz, Austria: Monthly Averages and Impact Trends
Exploring the changing climate in Graz, Austria
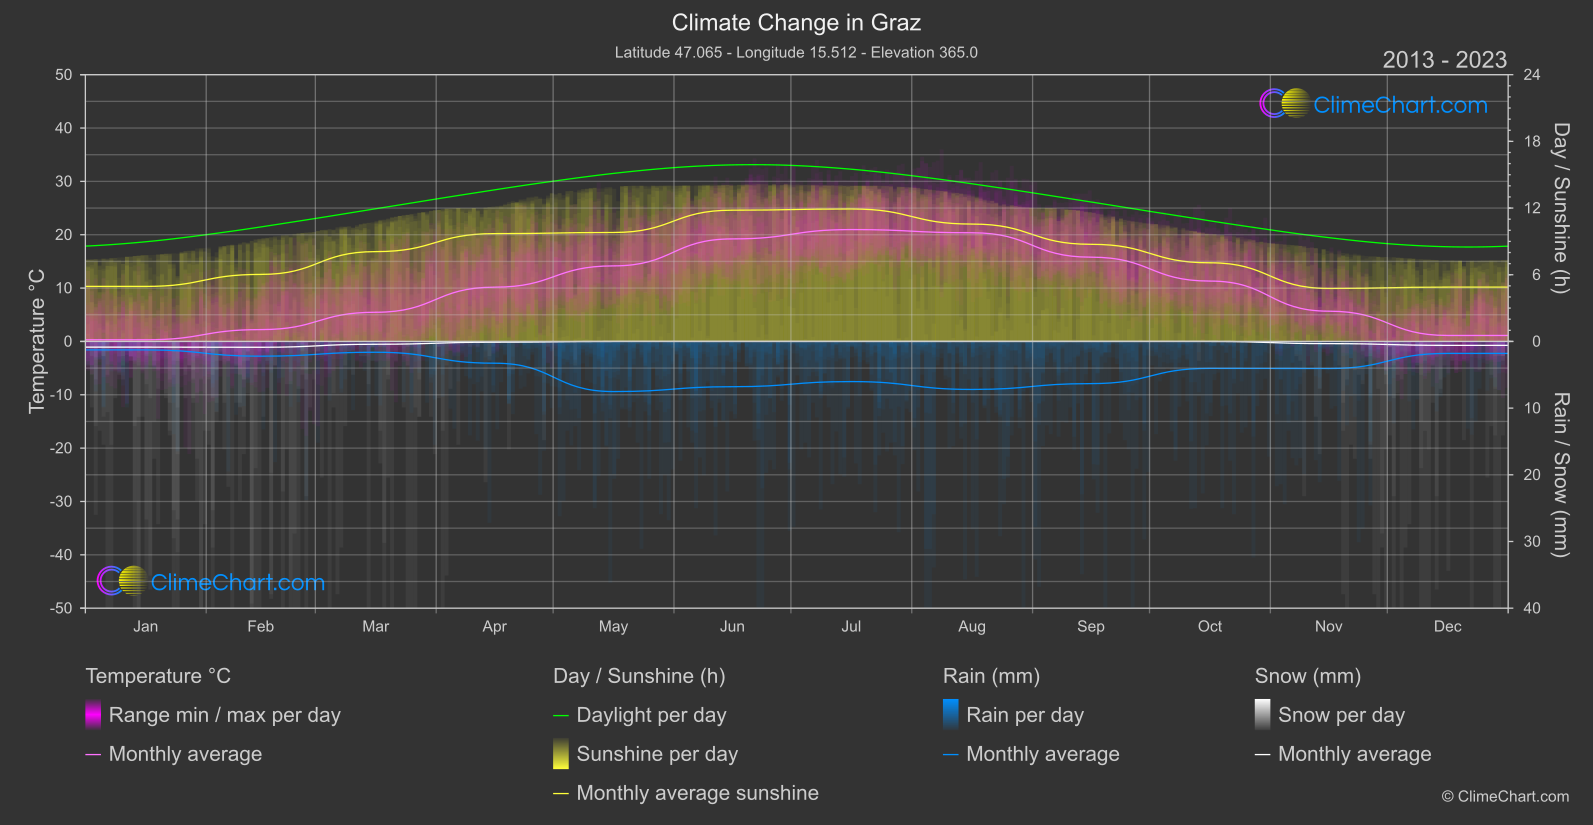
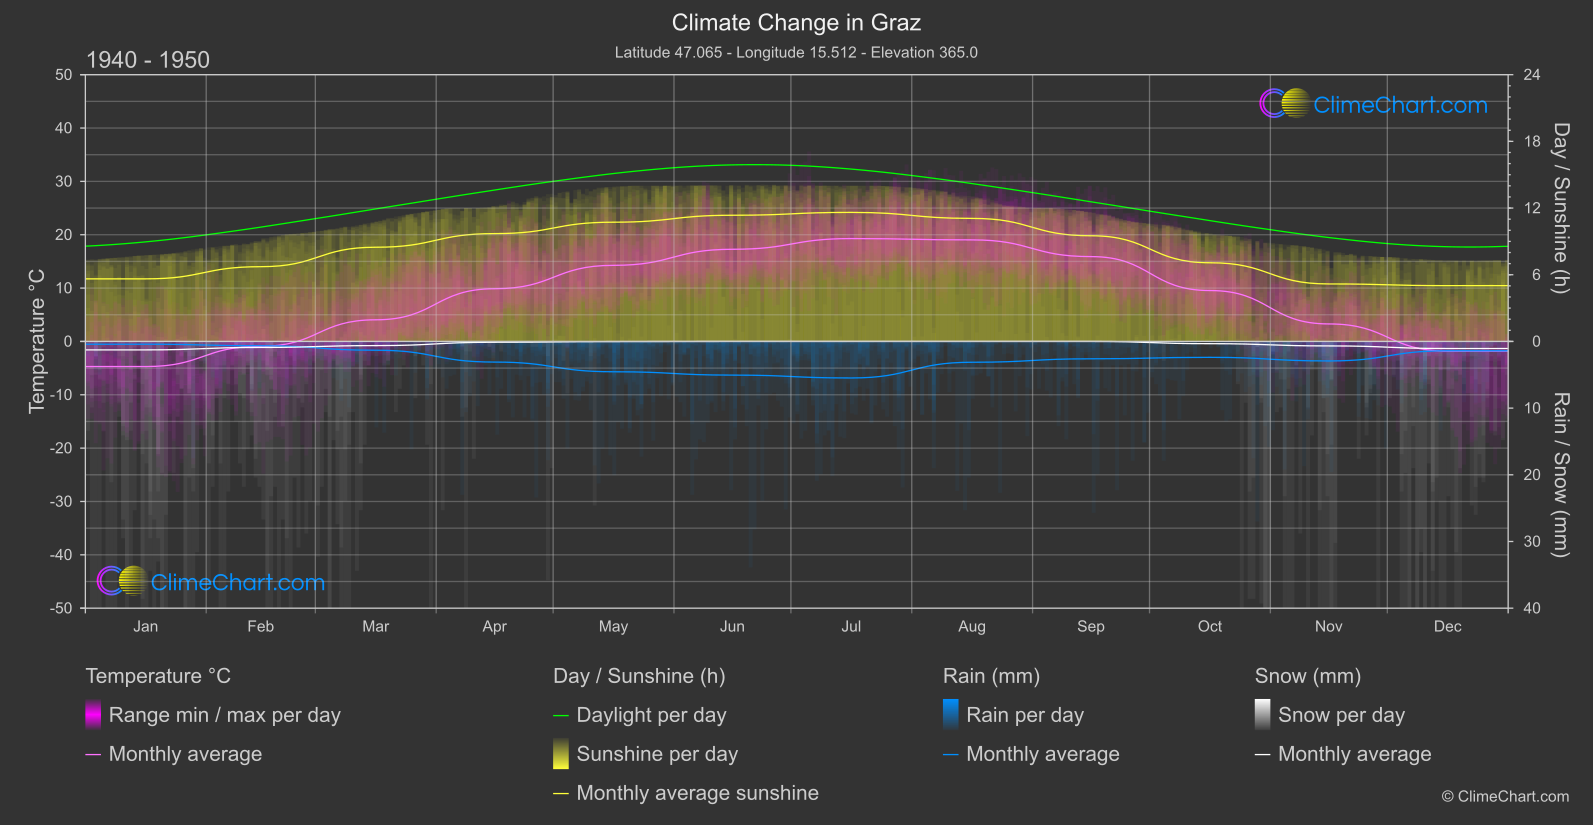
Graz, Austria, has experienced notable changes in temperature, rainfall, snowfall, and sunshine duration over the years. Comparing data from 1940-1950 to 2013-2024 reveals interesting insights. For instance, the month of August saw a significant temperature increase of 1.33°C, while the month of August also experienced a notable rainfall increase of 2.04 mm. Additionally, the data shows a decrease in snowfall across most months, with December showing a decrease of 0.23 mm. Sunshine duration varied throughout the months, with November experiencing a decrease of 0.40 hours.
Climate Change Data Overview for Graz, Austria
Explore the comprehensive climate change data for Graz, Austria. This detailed table provides valuable insights into temperature variations, precipitation levels, and seasonal changes influenced by climate change, helping you understand the unique weather patterns of this region.
Temperature °C
| Month | ⌀ 1940 - 1950 | ⌀ 2013 - 2023 | +/- |
|---|---|---|---|
| Jan | -4.71 | 0.30 | 5.01 |
| Feb | -0.91 | 2.22 | 3.12 |
| Mar | 4.06 | 5.47 | 1.41 |
| Apr | 9.88 | 10.17 | 0.29 |
| May | 14.26 | 14.16 | -0.10 |
| Jun | 17.27 | 19.22 | 1.95 |
| Jul | 19.28 | 20.97 | 1.69 |
| Aug | 19.03 | 20.37 | 1.33 |
| Sep | 15.90 | 15.79 | -0.11 |
| Oct | 9.54 | 11.31 | 1.77 |
| Nov | 3.28 | 5.67 | 2.39 |
| Dec | -1.82 | 1.12 | 2.94 |
| ⌀ Month | 8.76 | 10.56 | 1.81 |
Sunshine (h)
| Month | ⌀ 1940 - 1950 | ⌀ 2013 - 2023 | +/- |
|---|---|---|---|
| Jan | 5.63 | 4.95 | -0.68 |
| Feb | 6.72 | 6.03 | -0.69 |
| Mar | 8.48 | 8.08 | -0.39 |
| Apr | 9.70 | 9.70 | -0.00 |
| May | 10.73 | 9.80 | -0.93 |
| Jun | 11.35 | 11.81 | 0.46 |
| Jul | 11.61 | 11.92 | 0.31 |
| Aug | 11.07 | 10.56 | -0.51 |
| Sep | 9.51 | 8.74 | -0.77 |
| Oct | 7.08 | 7.08 | -0.00 |
| Nov | 5.17 | 4.77 | -0.40 |
| Dec | 5.02 | 4.89 | -0.13 |
| ⌀ Month | 8.51 | 8.19 | -0.31 |
Rain (mm)
| Month | ⌀ 1940 - 1950 | ⌀ 2013 - 2023 | +/- |
|---|---|---|---|
| Jan | 0.21 | 0.63 | 0.43 |
| Feb | 0.33 | 1.10 | 0.78 |
| Mar | 0.66 | 0.81 | 0.15 |
| Apr | 1.55 | 1.63 | 0.08 |
| May | 2.27 | 3.76 | 1.48 |
| Jun | 2.53 | 3.39 | 0.87 |
| Jul | 2.74 | 3.01 | 0.27 |
| Aug | 1.56 | 3.60 | 2.04 |
| Sep | 1.30 | 3.16 | 1.86 |
| Oct | 1.19 | 2.02 | 0.83 |
| Nov | 1.46 | 2.03 | 0.57 |
| Dec | 0.70 | 0.90 | 0.20 |
| ⌀ Month | 1.38 | 2.17 | 0.80 |
Snow (mm)
| Month | ⌀ 1940 - 1950 | ⌀ 2013 - 2023 | +/- |
|---|---|---|---|
| Jan | 0.63 | 0.43 | -0.21 |
| Feb | 0.45 | 0.44 | -0.01 |
| Mar | 0.31 | 0.21 | -0.10 |
| Apr | 0.06 | 0.06 | -0.00 |
| May | 0.01 | 0.00 | -0.01 |
| Jun | 0.00 | 0.00 | 0.00 |
| Jul | 0.00 | 0.00 | 0.00 |
| Aug | 0.00 | 0.00 | 0.00 |
| Sep | 0.00 | 0.00 | 0.00 |
| Oct | 0.17 | 0.00 | -0.17 |
| Nov | 0.34 | 0.16 | -0.17 |
| Dec | 0.53 | 0.30 | -0.23 |
| ⌀ Month | 0.21 | 0.13 | -0.08 |