Climate Change Chart of El Pescadero, Mexico
Comprehensive Climate Change Chart of El Pescadero, Mexico: Monthly Averages and Impact Trends
Exploring the climate change in El Pescadero, Mexico reveals intriguing insights into temperature, rainfall, and sunshine duration fluctuations over time.
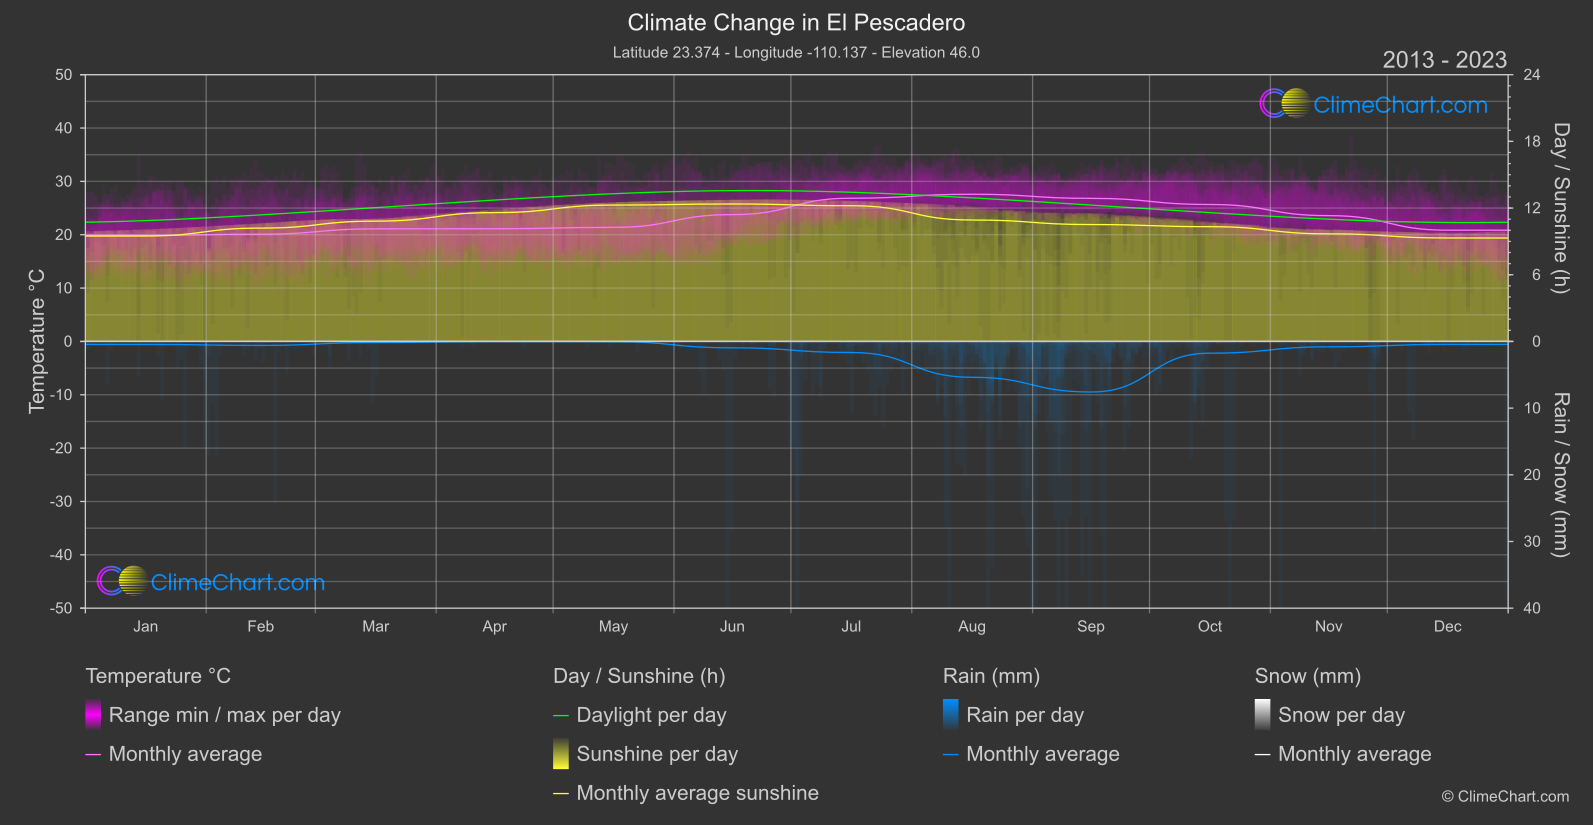
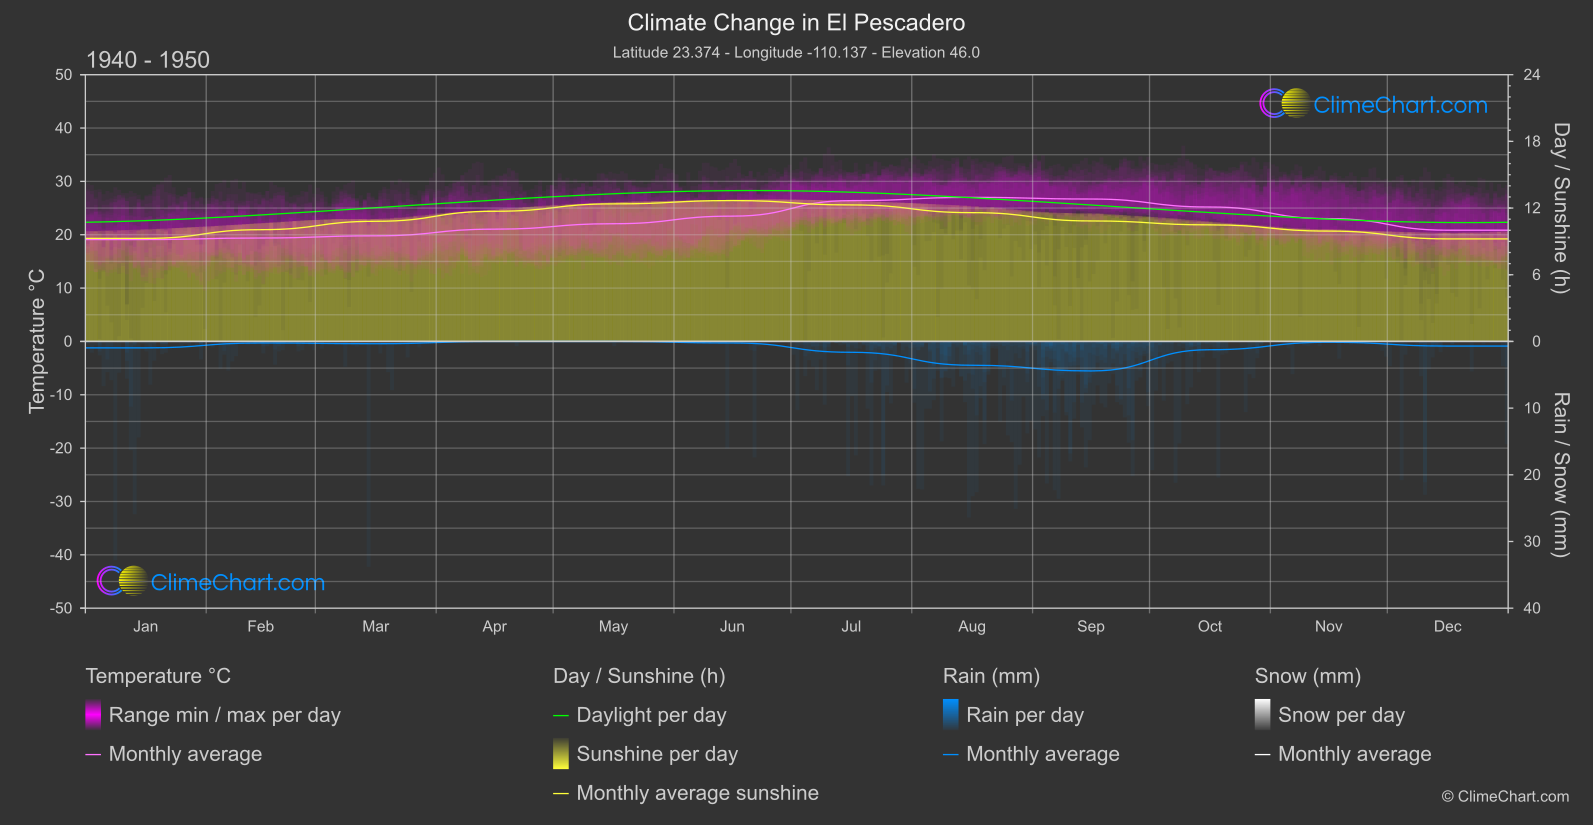
El Pescadero, Mexico, has experienced notable changes in climate over the years. From January to December, temperature variations are evident, with March showing the highest increase of 1.30°C compared to the past. Rainfall patterns also fluctuate, with September witnessing the most significant rise of 1.58 mm. Sunshine duration displays fluctuations, with August experiencing a decrease of 0.66 hours. These insights highlight the impact of climate change on El Pescadero.
Climate Change Data Overview for El Pescadero, Mexico
Explore the comprehensive climate change data for El Pescadero, Mexico. This detailed table provides valuable insights into temperature variations, precipitation levels, and seasonal changes influenced by climate change, helping you understand the unique weather patterns of this region.
Temperature °C
| Month | ⌀ 1940 - 1950 | ⌀ 2013 - 2023 | +/- |
|---|---|---|---|
| Jan | 19.10 | 19.88 | 0.77 |
| Feb | 19.39 | 20.10 | 0.72 |
| Mar | 19.80 | 21.10 | 1.30 |
| Apr | 21.05 | 21.12 | 0.07 |
| May | 22.06 | 21.38 | -0.68 |
| Jun | 23.49 | 23.77 | 0.28 |
| Jul | 26.40 | 26.84 | 0.45 |
| Aug | 27.01 | 27.59 | 0.58 |
| Sep | 26.69 | 26.82 | 0.13 |
| Oct | 25.20 | 25.67 | 0.47 |
| Nov | 23.02 | 23.58 | 0.56 |
| Dec | 20.85 | 20.85 | 0.00 |
| ⌀ Month | 22.84 | 23.22 | 0.39 |
Sunshine (h)
| Month | ⌀ 1940 - 1950 | ⌀ 2013 - 2023 | +/- |
|---|---|---|---|
| Jan | 9.27 | 9.49 | 0.21 |
| Feb | 10.05 | 10.20 | 0.14 |
| Mar | 10.81 | 10.82 | 0.01 |
| Apr | 11.71 | 11.59 | -0.12 |
| May | 12.38 | 12.27 | -0.11 |
| Jun | 12.67 | 12.37 | -0.31 |
| Jul | 12.28 | 12.21 | -0.07 |
| Aug | 11.59 | 10.92 | -0.66 |
| Sep | 10.84 | 10.52 | -0.32 |
| Oct | 10.49 | 10.32 | -0.16 |
| Nov | 9.93 | 9.68 | -0.25 |
| Dec | 9.23 | 9.31 | 0.08 |
| ⌀ Month | 10.94 | 10.81 | -0.13 |
Rain (mm)
| Month | ⌀ 1940 - 1950 | ⌀ 2013 - 2023 | +/- |
|---|---|---|---|
| Jan | 0.48 | 0.22 | -0.26 |
| Feb | 0.12 | 0.30 | 0.18 |
| Mar | 0.17 | 0.08 | -0.09 |
| Apr | 0.00 | 0.01 | 0.01 |
| May | 0.00 | 0.02 | 0.02 |
| Jun | 0.12 | 0.48 | 0.36 |
| Jul | 0.81 | 0.83 | 0.01 |
| Aug | 1.79 | 2.69 | 0.90 |
| Sep | 2.21 | 3.79 | 1.58 |
| Oct | 0.62 | 0.88 | 0.26 |
| Nov | 0.06 | 0.40 | 0.34 |
| Dec | 0.35 | 0.22 | -0.13 |
| ⌀ Month | 0.56 | 0.83 | 0.27 |
Snow (mm)
| Month | ⌀ 1940 - 1950 | ⌀ 2013 - 2023 | +/- |
|---|---|---|---|
| Jan | 0.00 | 0.00 | 0.00 |
| Feb | 0.00 | 0.00 | 0.00 |
| Mar | 0.00 | 0.00 | 0.00 |
| Apr | 0.00 | 0.00 | 0.00 |
| May | 0.00 | 0.00 | 0.00 |
| Jun | 0.00 | 0.00 | 0.00 |
| Jul | 0.00 | 0.00 | 0.00 |
| Aug | 0.00 | 0.00 | 0.00 |
| Sep | 0.00 | 0.00 | 0.00 |
| Oct | 0.00 | 0.00 | 0.00 |
| Nov | 0.00 | 0.00 | 0.00 |
| Dec | 0.00 | 0.00 | 0.00 |
| ⌀ Month | 0.00 | 0.00 | 0.00 |