Climate Change Chart of Chefchaouen, Morocco
Comprehensive Climate Change Chart of Chefchaouen, Morocco: Monthly Averages and Impact Trends
Explore the climate change data for Chefchaouen, Morocco, and discover insights into the changing weather patterns.
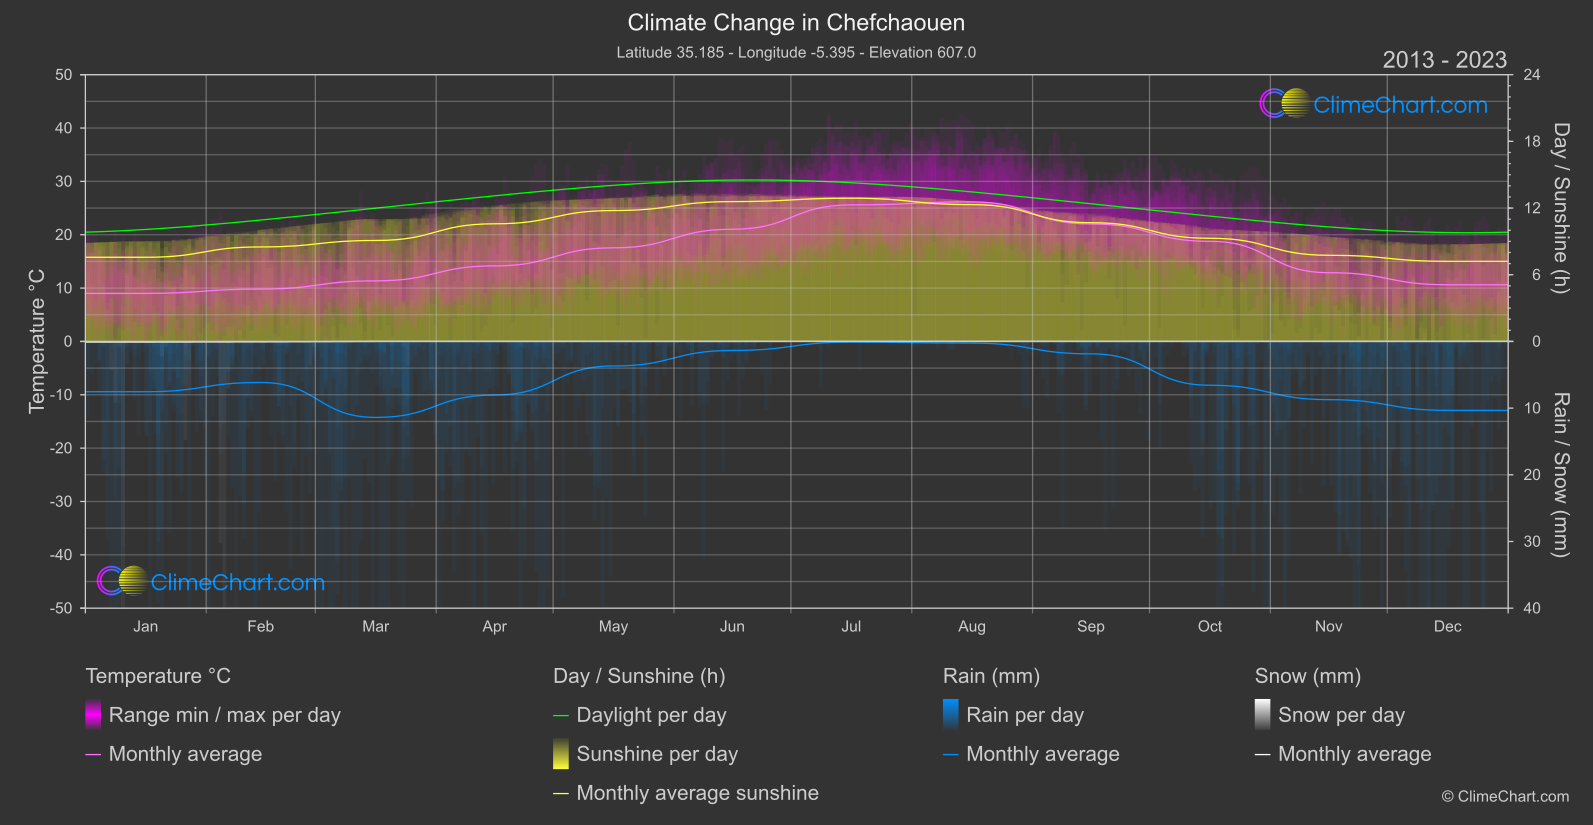
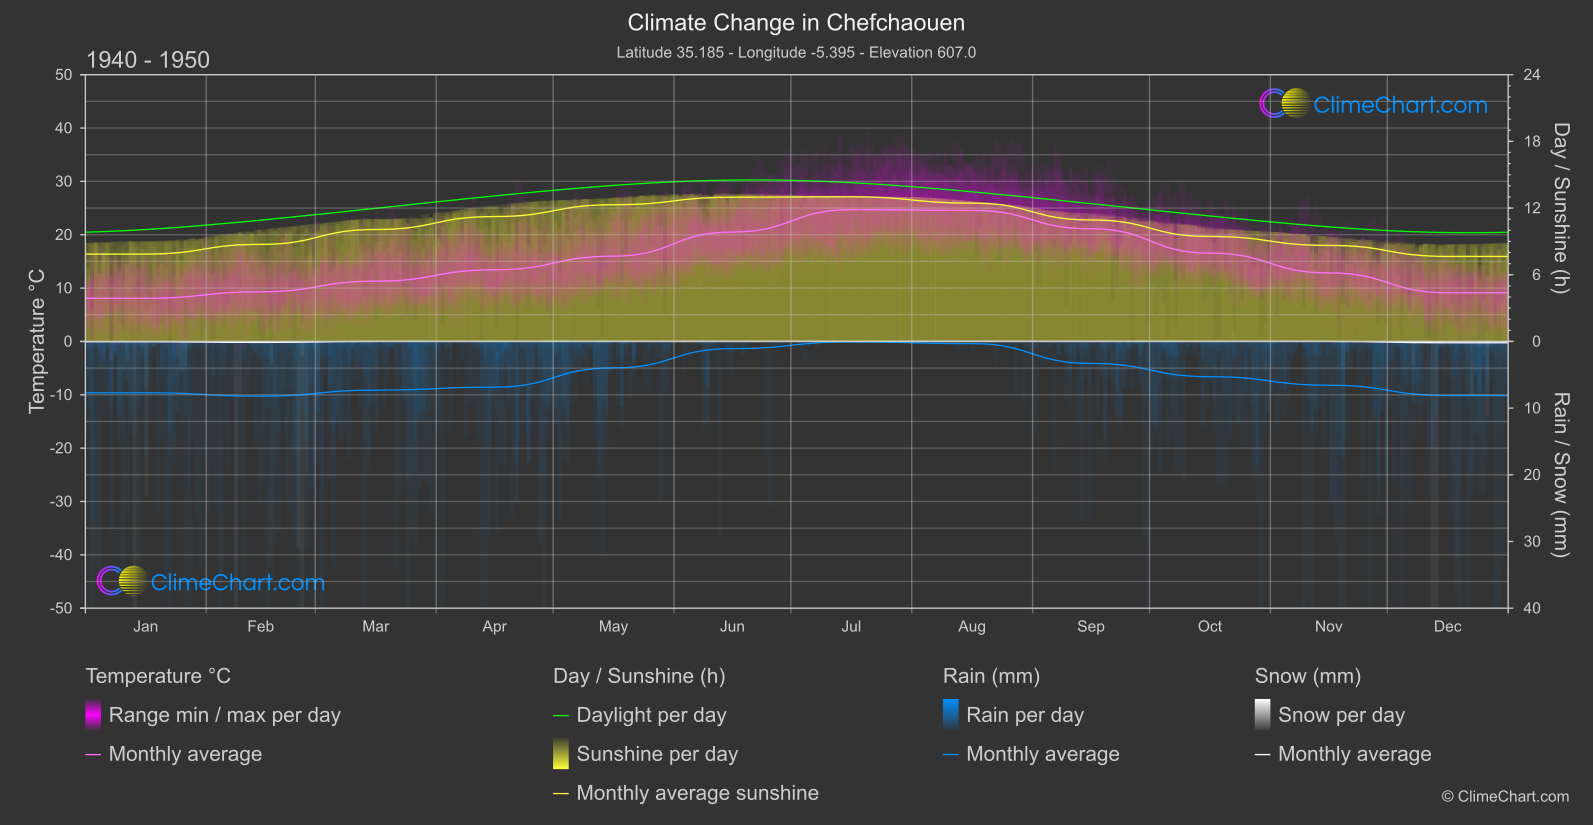
Chefchaouen, Morocco, has experienced significant changes in temperature, rainfall, snowfall, and sunshine duration over the years. Analyzing the data reveals that October has seen the highest increase in temperature, while March has witnessed the most significant rise in rainfall. The comparison between the years 1940-1950 and 2013-2024 showcases the impact of climate change on the region's weather patterns.
Climate Change Data Overview for Chefchaouen, Morocco
Explore the comprehensive climate change data for Chefchaouen, Morocco. This detailed table provides valuable insights into temperature variations, precipitation levels, and seasonal changes influenced by climate change, helping you understand the unique weather patterns of this region.
Temperature °C
| Month | ⌀ 1940 - 1950 | ⌀ 2013 - 2023 | +/- |
|---|---|---|---|
| Jan | 8.09 | 9.00 | 0.92 |
| Feb | 9.31 | 9.81 | 0.51 |
| Mar | 11.30 | 11.35 | 0.05 |
| Apr | 13.43 | 14.16 | 0.73 |
| May | 15.98 | 17.55 | 1.56 |
| Jun | 20.51 | 21.03 | 0.52 |
| Jul | 24.70 | 25.59 | 0.89 |
| Aug | 24.56 | 26.15 | 1.59 |
| Sep | 21.11 | 22.02 | 0.90 |
| Oct | 16.55 | 18.76 | 2.20 |
| Nov | 12.84 | 12.89 | 0.05 |
| Dec | 9.12 | 10.62 | 1.50 |
| ⌀ Month | 15.63 | 16.58 | 0.95 |
Sunshine (h)
| Month | ⌀ 1940 - 1950 | ⌀ 2013 - 2023 | +/- |
|---|---|---|---|
| Jan | 7.86 | 7.57 | -0.29 |
| Feb | 8.73 | 8.50 | -0.23 |
| Mar | 10.07 | 9.08 | -0.99 |
| Apr | 11.24 | 10.58 | -0.65 |
| May | 12.30 | 11.78 | -0.52 |
| Jun | 12.98 | 12.58 | -0.40 |
| Jul | 13.02 | 12.89 | -0.13 |
| Aug | 12.44 | 12.31 | -0.14 |
| Sep | 10.93 | 10.68 | -0.25 |
| Oct | 9.44 | 9.28 | -0.16 |
| Nov | 8.64 | 7.75 | -0.89 |
| Dec | 7.65 | 7.20 | -0.45 |
| ⌀ Month | 10.44 | 10.02 | -0.42 |
Rain (mm)
| Month | ⌀ 1940 - 1950 | ⌀ 2013 - 2023 | +/- |
|---|---|---|---|
| Jan | 3.85 | 3.77 | -0.08 |
| Feb | 4.10 | 3.08 | -1.03 |
| Mar | 3.65 | 5.70 | 2.05 |
| Apr | 3.43 | 4.02 | 0.59 |
| May | 1.98 | 1.84 | -0.14 |
| Jun | 0.54 | 0.68 | 0.14 |
| Jul | 0.03 | 0.05 | 0.02 |
| Aug | 0.16 | 0.13 | -0.04 |
| Sep | 1.65 | 0.93 | -0.72 |
| Oct | 2.64 | 3.28 | 0.64 |
| Nov | 3.28 | 4.36 | 1.08 |
| Dec | 4.06 | 5.17 | 1.11 |
| ⌀ Month | 2.45 | 2.75 | 0.30 |
Snow (mm)
| Month | ⌀ 1940 - 1950 | ⌀ 2013 - 2023 | +/- |
|---|---|---|---|
| Jan | 0.02 | 0.04 | 0.02 |
| Feb | 0.07 | 0.03 | -0.05 |
| Mar | 0.00 | 0.00 | 0.00 |
| Apr | 0.00 | 0.00 | 0.00 |
| May | 0.00 | 0.00 | 0.00 |
| Jun | 0.00 | 0.00 | 0.00 |
| Jul | 0.00 | 0.00 | 0.00 |
| Aug | 0.00 | 0.00 | 0.00 |
| Sep | 0.00 | 0.00 | 0.00 |
| Oct | 0.00 | 0.00 | 0.00 |
| Nov | 0.00 | 0.00 | -0.00 |
| Dec | 0.10 | 0.00 | -0.10 |
| ⌀ Month | 0.02 | 0.01 | -0.01 |