Climate Change Chart of Cardiff, Great Britain
Comprehensive Climate Change Chart of Cardiff, Great Britain: Monthly Averages and Impact Trends
Exploring the climate changes in Cardiff, United Kingdom, reveals intriguing insights into temperature, rainfall, snowfall, and sunshine duration over the years.
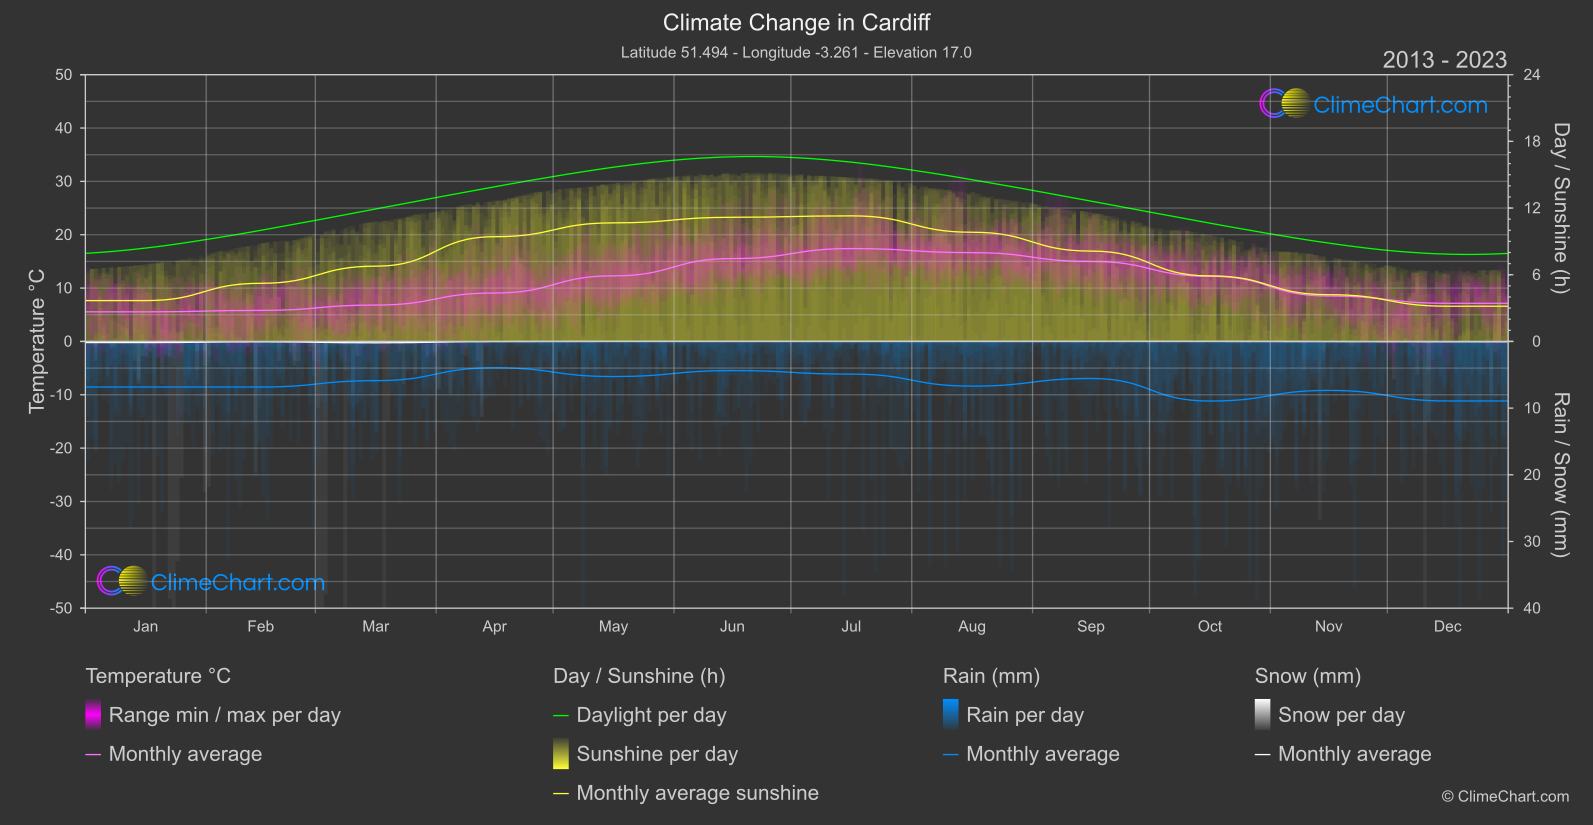
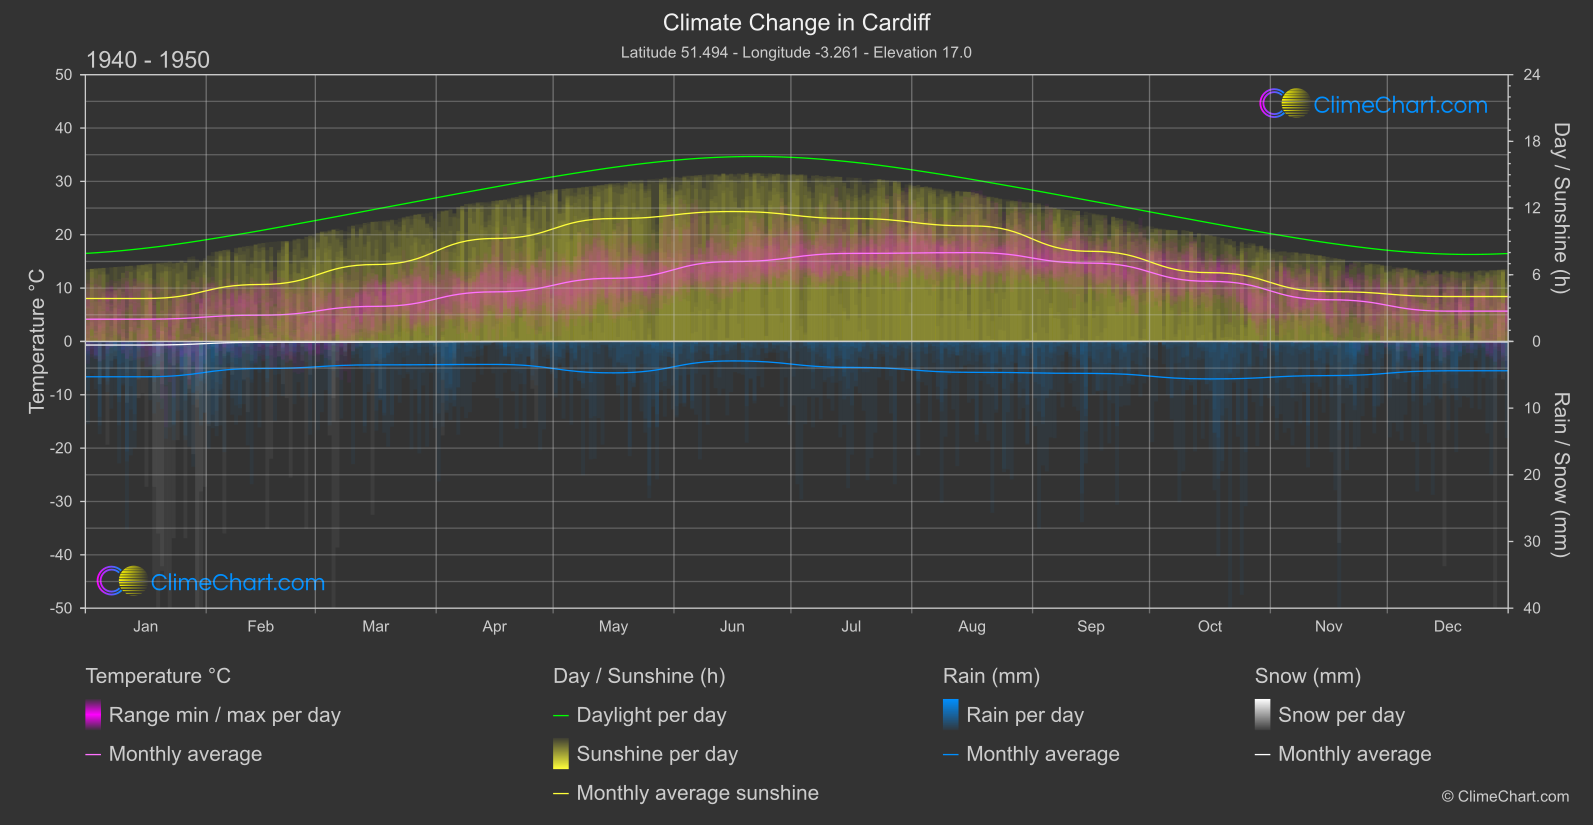
Cardiff, the capital of Wales, experiences notable changes in temperature, with December showing the highest increase of 1.47°C in the period analyzed. In terms of rainfall, October exhibits a substantial rise of 1.66 mm, indicating a significant shift in precipitation patterns. Snowfall remains minimal throughout the year, with only slight fluctuations observed. Sunshine duration varies across the months, with August showcasing the largest decline of 0.57 hours compared to historical data.
Climate Change Data Overview for Cardiff, Great Britain
Explore the comprehensive climate change data for Cardiff, Great Britain. This detailed table provides valuable insights into temperature variations, precipitation levels, and seasonal changes influenced by climate change, helping you understand the unique weather patterns of this region.
Temperature °C
| Month | ⌀ 1940 - 1950 | ⌀ 2013 - 2023 | +/- |
|---|---|---|---|
| Jan | 4.17 | 5.55 | 1.38 |
| Feb | 4.92 | 5.82 | 0.89 |
| Mar | 6.57 | 6.82 | 0.25 |
| Apr | 9.29 | 9.08 | -0.22 |
| May | 11.84 | 12.29 | 0.45 |
| Jun | 14.97 | 15.53 | 0.56 |
| Jul | 16.50 | 17.40 | 0.91 |
| Aug | 16.65 | 16.64 | -0.00 |
| Sep | 14.68 | 14.99 | 0.32 |
| Oct | 11.27 | 12.21 | 0.94 |
| Nov | 7.81 | 8.51 | 0.70 |
| Dec | 5.68 | 7.15 | 1.47 |
| ⌀ Month | 10.36 | 11.00 | 0.64 |
Sunshine (h)
| Month | ⌀ 1940 - 1950 | ⌀ 2013 - 2023 | +/- |
|---|---|---|---|
| Jan | 3.86 | 3.67 | -0.19 |
| Feb | 5.12 | 5.23 | 0.11 |
| Mar | 6.92 | 6.77 | -0.15 |
| Apr | 9.26 | 9.42 | 0.16 |
| May | 11.06 | 10.67 | -0.39 |
| Jun | 11.69 | 11.17 | -0.52 |
| Jul | 11.06 | 11.30 | 0.24 |
| Aug | 10.39 | 9.82 | -0.57 |
| Sep | 8.11 | 8.13 | 0.02 |
| Oct | 6.19 | 5.90 | -0.29 |
| Nov | 4.49 | 4.21 | -0.28 |
| Dec | 4.04 | 3.17 | -0.87 |
| ⌀ Month | 7.68 | 7.46 | -0.23 |
Rain (mm)
| Month | ⌀ 1940 - 1950 | ⌀ 2013 - 2023 | +/- |
|---|---|---|---|
| Jan | 2.65 | 3.42 | 0.77 |
| Feb | 2.03 | 3.42 | 1.39 |
| Mar | 1.76 | 2.94 | 1.18 |
| Apr | 1.72 | 1.98 | 0.25 |
| May | 2.36 | 2.63 | 0.28 |
| Jun | 1.46 | 2.19 | 0.72 |
| Jul | 1.95 | 2.45 | 0.50 |
| Aug | 2.32 | 3.35 | 1.03 |
| Sep | 2.40 | 2.78 | 0.38 |
| Oct | 2.81 | 4.47 | 1.66 |
| Nov | 2.56 | 3.67 | 1.11 |
| Dec | 2.20 | 4.46 | 2.26 |
| ⌀ Month | 2.18 | 3.15 | 0.96 |
Snow (mm)
| Month | ⌀ 1940 - 1950 | ⌀ 2013 - 2023 | +/- |
|---|---|---|---|
| Jan | 0.27 | 0.09 | -0.18 |
| Feb | 0.07 | 0.03 | -0.04 |
| Mar | 0.05 | 0.10 | 0.05 |
| Apr | 0.01 | 0.01 | -0.00 |
| May | 0.00 | 0.00 | 0.00 |
| Jun | 0.00 | 0.00 | 0.00 |
| Jul | 0.00 | 0.00 | 0.00 |
| Aug | 0.00 | 0.00 | 0.00 |
| Sep | 0.00 | 0.00 | 0.00 |
| Oct | 0.00 | 0.00 | 0.00 |
| Nov | 0.01 | 0.01 | 0.00 |
| Dec | 0.04 | 0.03 | -0.01 |
| ⌀ Month | 0.04 | 0.02 | -0.02 |